Download
1 / 42
450 likes | 507 Views
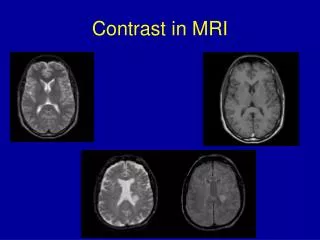
Functional MRI: Image Contrast and Acquisition. Karla L. Miller FMRIB Centre, Oxford University. Functional MRI Acquisition. Basics of FMRI FMRI Contrast: The BOLD Effect Standard FMRI Acquisition Confounds and Limitations Beyond the Basics New Frontiers in FMRI

E N D
Functional MRI: Image Contrast and Acquisition Karla L. Miller FMRIB Centre, Oxford University
Functional MRI Acquisition Basics of FMRI FMRI Contrast: The BOLD Effect Standard FMRI Acquisition Confounds and Limitations Beyond the Basics New Frontiers in FMRI What Else Can We Measure? Basics of FMRI FMRI Contrast: The BOLD Effect Standard FMRI Acqusition Confounds and Limitations Beyond the Basics New Frontiers in FMRI What Else Can We Measure?
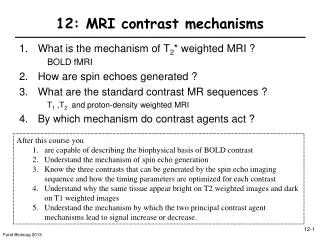
The BOLD Effect BOLD: Blood Oxygenation Level Dependent Deoxyhemoglobin (dHb) has different resonance frequency than water dHb acts as endogenous contrast agent dHb in blood vessel creates frequency offset in surrounding tissue (approx as dipole pattern)
The BOLD Effect Frequency spread causes signal loss over time BOLD contrast: Amount of signal loss reflects [dHb] Contrast increases with delay (TE = echo time)
neuron HbO2 = oxyhemoglobin dHb = deoxyhemoglobin HbO2 HbO2 HbO2 HbO2 HbO2 dHb HbO2 HbO2 HbO2 dHb dHb dHb dHb HbO2 HbO2 HbO2 HbO2 HbO2 HbO2 HbO2 HbO2 dHb HbO2 dHb dHb HbO2 HbO2 dHb HbO2 HbO2 HbO2 HbO2 HbO2 HbO2 HbO2 O2 metabolism blood volume [dHb] blood flow Vascular Response to Activation capillary
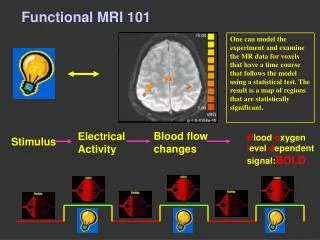
Blood flow Metabolism Neuronal activity BOLD signal [dHb] Blood volume Sources of BOLD Signal Very indirect measure of activity (via hemodynamic response to neural activity)! Complicated dynamics lead to reduction in [dHb] during activation (active research area)
BOLD Contrast vs. TE • BOLD effect is approximately an exponential decay: S(TE) = S0 e–TE R2*S(TE) TE R2* • R2* encapsulates all sources of signal dephasing, including sources of artifact (also increase with TE) • Gradient echo (GE=GRE=FE) with moderate TE 1–5% change
Functional MRI Acquisition Basics of FMRI FMRI Contrast: The BOLD Effect Standard FMRI Acquisition Confounds and Limitations Beyond the Basics New Frontiers in FMRI What Else Can We Measure?
on on on on Stimulus pattern off off off off off Predicted BOLD signal time The Canonical FMRI Experiment • Subject is given sensory stimulation or task, interleaved with control or rest condition • Acquire timeseries of BOLD-sensitive images during stimulation • Analyse image timeseries to determine where signal changed in response to stimulation
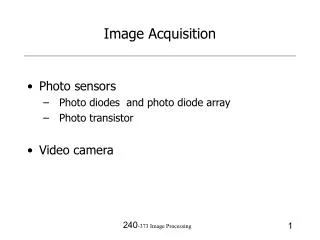
What is required of the scanner? • Must resolve temporal dynamics of stimulus (typically, stimulus lasts 1-30 s) • Requires rapid imaging: one image every few seconds (typically, 2–4 s) • Anatomical images take minutes to acquire! • Acquire images in single shot (or a small number of shots) image 1 2 3 …
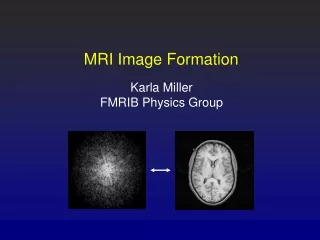
ky kx Review: Image Formation • Data gathered in k-space (Fourier domain of image) • Gradients change position in k-space during data acquisition (location in k-space is integral of gradients) • Image is Fourier transform of acquired data Fourier transform imagespace k-space
ky kx Raster-scan (2DFT) k-space acquisition • Collect separate line each repetition period (TR) • “Multi-shot”: image pieced together over multiple TR • Images have few artifats, but take minutes to acquire
ky kx Echo-planar imaging (EPI) • “Single-shot”: Collect entire image each TR • Increase in acquisition speed (good for FMRI) • Longer readout each TR (introduces image artifacts)
ky kx Partial k-space c+id a+ib aib cid If data doesn’t have phase errors, quadrants of k-space contain redundant information (Hermetian symmetry) Partial k-space: acquire half of k-space and “fill in” missing data based on symmetry
ky kx Partial k-space EPI Reduces TE (sacrifices some functional contrast) Must acquire slightly more than half (Hermetian symmetry is approximate) Slight blurring added to image
Spiral FMRI • Currently, only serious alternative to EPI • Short apparent TE (center of k-space acquired early) • Fast and efficient use of gradient hardware • Reconstruction must resample onto grid before FFT • Different artifacts than EPI (not necessarily better)
Trajectory considerations • Longer readout = more image artifacts • Single-shot (EPI & spiral) warping or blurring • PR & 2DFT have very short readouts and few artifacts • Cartesian (2DFT, EPI) vs radial (PR, spiral) • 2DFT & EPI = ghosting & warping artifacts • PR & spiral = blurring artifacts • SNR for N shots with time per shot Tread : SNR Ttotal= N x Tread
Typical* FMRI Parameters * These values are typical, not fixed!!
Functional MRI Acquisition Basics of FMRI FMRI Contrast: The BOLD Effect Standard FMRI Acquisition Confounds and Limitations Beyond the Basics New Frontiers in FMRI What Else Can We Measure?
The BOLD Effect BOLD contrast is based on signal dephasing BOLD imaging requires long delay (TE) for contrast
Signal Dropout in BOLD Dephasing also occurs near air-tissue boundaries due to abrupt shift in magnetic susceptibility Sensitivity to BOLD effect implies problems near air-tissue boundaries (e.g., sinuses)!
Non-BOLD BOLD BOLD Signal Dropout Dephasing near air-tissue boundaries (e.g., sinuses) BOLD contrast coupled to signal loss (“black holes”)
EPI Multi-shot Image Warping Position information is encoded in local frequency Imperfections in magnetic field (frequency offsets) masquerade as information about position Signal from regions with offset gets misplaced Longer readouts leads to greater displacement
Field Offset field offset local warping local blur Field map EPI Spiral • Object interacts with magnetic field, introduces local imperfections (first-order correction with “shim” fields) • Field offset introduces phase accrual during readout • EPI: field offsets warp image (PSF linear phase along y) • Spiral: field offsets blur image (PSF has conical phase)
EPI Unwarping field map uncorrected corrected Can measure local frequency (“field map”) Estimate distortion from field map and remove it Field map correction introduces blurring [Jenkinson et al]
2DFT EPI Timing Errors • Timing errors delay readout along kx and/or ky • Analyze via k-space point-spread function (PSF) • Shift in k-space PSF modulates image phase • Phase cancellation patterns in image (can be complicated) • Many causes: hardware delays, eddy currents… Spiral
EPI EPI Ghosting Odd and even lines mismatch (e.g., due to timing errors, eddy currents) Causes aliasing (“ghosting”) To fix: measure shifts with reference scan, shift back in reconstruction “ghost” = + undersampled
7T 7T 3T 1.5T 3T 1.5T Physiological “Noise” Thermal SNR Timecourse SNR • Respiration, cardiac pulsation, neural networks • Thermal SNR linear in voxel volume, B0 • Physiological noise tends to be “BOLD-like”: increases with TE and B0 voxel volume voxel volume
Functional MRI Acquisition Basics of FMRI FMRI Contrast: The BOLD Effect Standard FMRI Acquisition Confounds and Limitations Beyond the Basics New Frontiers in FMRI What Else Can We Measure?
Volume coil 8-channel array Receive RF coils and SNR SNR receive volume Volume coils signal and noise from entire volume good coverage, moderate SNR Surface coils localize signal and noise reduced coverage, good SNR Multi-channel coils array of “independent” surface coils good coverage Surface coil
Surface coils Single coil 8-channel array Parallel imaging (SENSE, SMASH, etc) • Coil sensitivity encodes spatial information • Can “leave out” large parts of k-space • Theory: For n coils, only need 1/n of k-space • Practice: Need at least ~1/3 of k-space • In general, incurs loss of SNR • More coverage, higher resolution, faster imaging, etc.
FMRI at High Field (>3T) • SNR and BOLD increase with field strength • Physiological noise means practical gain is less • Benefits: Resolution • Problems: Artifacts, RF heating, wavelength effects…
High-resolution FMRI at 7T High-res 7T: 0.58 x 0.58 x 0.58 mm3 = 0.2 mm3 High-res 3T: 1 x 1 x 1 mm3 = 1 mm3 Conventional 3T: 3 x 3 x 3 mm3 = 27 mm3
Functional MRI Acquisition Basics of FMRI FMRI Contrast: The BOLD Effect Standard FMRI Acquisition Confounds and Limitations Beyond the Basics New Frontiers in FMRI What Else Can We Measure?
Blood flow Metabolism Neuronal activity BOLD signal [dHb] Blood volume Sources of BOLD Signal Yes! (ASL) Maybe… No…? Probably (VASO) BOLD ([dHb]) is a very indirect measure of activity Can MRI get closer to the action?
z (=B0) inversion slab excitation y x inversion imaging plane FMRI of Blood Flow: ASL • Perfusion: delivery of metabolites (via local blood flow) • Arterial Spin Labeling (ASL): invert of in-flowing blood • IMAGEperfusion = IMAGEuninverted - IMAGEinverted blood
white matter (low perfusion) grey matter (high perfusion) Perfusion image FMRI of Blood Flow: ASL ASL “kinetic curve” • Represents an interesting physiological parameter • Quantitative: fit kinetic curve for perfusion in ml/100g/min • Lower SNR than BOLD • Limited coverage (~5 slices) 0.8 0.6 Signal change (%) 0.4 0.2 0.0 0 1 2 3 4 Time (s)
FMRI of Blood Volume: VASO • Vascular Space Occupancy (VASO): null blood volume • Invert everything (blood + tissue) • Image when blood is at null point (no blood signal) • Change in blood volume causes signal change [Lu et al, MRM 2003]
Diffusion Tensor Imaging (DTI) • Water diffusion restricted along white matter • Sensitize signal to diffusion in different directions • Measure along all directions, infer tracts Diffusion direction
z y x Color-coded directions Tract-based connectivity Diffusion Tensor Imaging (DTI) • Complementary information to FMRI • FMRI: gray matter, information processing • DTI: white matter, information pathways • Tractography: tracing white matter pathways between gray matter regions
Recommended Reading Introduction to Functional Magnetic Resonance Imaging, by Buxton Handbook of MRI Pulse Sequences, by Bernstein, King & Zhou These slides: http://www.fmrib.ox.ac.uk/~karla/