Download
1 / 25
250 likes | 376 Views
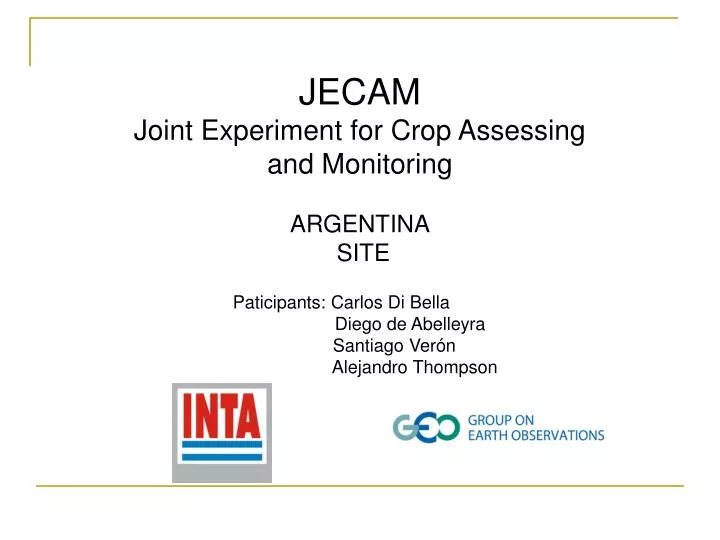
JECAM Joint Experiment for Crop Assessing and Monitoring. ARGENTINA SITE. Paticipants: Carlos Di Bella Diego de Abelleyra Santiago Verón Alejandro Thompson. JECAM Objectives:.

E N D
JECAM Joint Experiment for Crop Assessing and Monitoring ARGENTINA SITE Paticipants: Carlos Di Bella Diego de Abelleyra Santiago Verón Alejandro Thompson
JECAM Objectives: The goal of JECAM is to reach a convergence of approaches, develop monitoring and reporting protocols and best practices for a variety of global agricultural systems. JECAM will facilitate the comparisson of results of crop monitoring based on different sources of data and methodologies over a variety of global cropping systems
Production Systems in the Argentina Pampas • Mostly no till systems in rainfed conditions • Principal soil use: • Winter crops: Wheat, Barley • Summer crops: Soybean, Maize, Sunflower • Grasslands and Pastures
Study Site: San Antonio de Areco - Location: 100 Km from Buenos Aires - Representative rural area of the Argentine Pampas - Part of the ondulated pampa (gently slopes and rivers). - Soils: composed mostly of Mollisols (Deep surface layer with high organic mater content) being one of the most productives zones of Argentina 20 Km San Antonio de Areco 100 Km 70 Km Buenos Aires
SOYBEAN harvested area (Ha) WHEAT harvested area (Ha) SOYBEAN mean yield (Kg/Ha) WHEAT mean yield (Kg/Ha) SOYBEAN Production (Tn) WHEAT Production (Tn) Crop Production = harvested area x mean yield Crop production statistics at national level in Argentina (2000-2010). MINAGRI
variablity in planted area of each crop variability in crop yield Environmental situation (drought, water excess) Crop management practices Interanual variability in crop production In addition to available optical information, RADAR systems, because of their ability to obtain images independently of cloud conditions, assure the acquisition of images in the key periods that determine crop yields. Nevertheless, studies that relates RADAR indices and crop status are not as frequent as what was done with optical sensors.
Main objective of Argentine JECAM Site: Estimate parameters that describe wheat and soybean growth and algorithms that allow the identification of different crop species in the Argentine Pampas through the integration of information derived from optical and RADAR systems.
Objectives at Argentina site: 1. Estimation of biophysical parameters in wheat and soybean crops 2. Crop type and tillage system classification, and phenological events identification - High frequency of in situ observations and image aquisitions - Smaller area - Lower frequency of in situ observations and image aquisitions - Larger area 70 Km 20 Km San Antonio de Areco Intensive data collection area Extensive data collection area
Extensive data collection timing and required image acquisitions Intensive data collection timing and required image acquisitions (wheat and soybean crops) Crop Calendar in Argentine Pampas SOYBEAN MAIZE WHEAT J J A S O N D J F M A M J
Image Data required: RADAR: X band: TerraSAR X C band: RADARSAT-2, ENVISAT ASAR L band: ALOS PALSAR Optical: LANDSAT 5 MODIS ALOS AVNIR-2 ALOS PRISM LISS 3-4 AWIFS HJ1-Hyperspectral
Intensive data collection Measurements on wheat (august to november 2010) and early and late soybean crops (november 2010 to april 2011): • Crop biomass • Crop water content • Crop Height • fAPAR • Crop cover / LAI • Crop phenology • Gravimetric soil moisture (0-5 cm) Measurement frequency: 24 days aprox. Additional measurements: row direction, row space, in situ soil moisture sensors with dataloggers Measurements over fallow plots: - Green cover - Gravimetric soil moisture (0-5 cm)
Intensive data collection area - Field Campaign 2010/2011 Plots: Wheat / Late Soybean Wheat / Fallow Fallow / Early Soybean Measurements every 24 days from august 2010 to april 2011
Extensive surveys: • August / September 2010: Identification of winter crops, fallow and grassland areas and Identification of conventional ploughing plots • October 2010: Identification of heading in wheat fields • January / February 2011: Identification of summer crops (maize, soybean, sorghum)
Extensive data collection area - Field Campaign 2010/2011 - • Surveys: • Crop type • Tillage system • Phenological state (wheat heading)
RADARSAT-2 acquisitions (C band) - Extensive Field Campaign 2010/2011 • Main acquisition periods: • October 2010 • December 2010 • February 2011 • March 2011 * Available at CCRS catalogue
RADARSAT-2 acquisitions (C band) - Intensive Field Campaign 2010/2011 * Available at CCRS catalogue
ALOS PALSAR (L band) acquisitions – Field campaign 2010-2011 * Available at ALOS catalogue
Other obtained images - Field Campaign 2010/2011 • LANDSAT 5 TM: Paths/Rows: 226-84 & 225/84 • daily MOD09 & MYD09: 250 m resolution • EO-1 ALI (August 2010) LANDSAT Tiles
BRDF corrected data Daily MODIS 250 m – Wheat fields – San Antonio de Areco Original data Sowing dates: Early wheat: 06/09/2010 (161) Late wheat: 07/15/2010 (197)
Future activities: • - RADAR image analysis (availabilty of RADARSAT-2 images required) • Continue analyzing relations between crop parameters and image derived information (optical and RADAR indices) • Add RADAR information to improve typical land use classifcations perfomed with optical images (LANDSAT) • MODIS BRDF correction validation
Thank you! Obrigado!