Download
1 / 18
190 likes | 373 Views
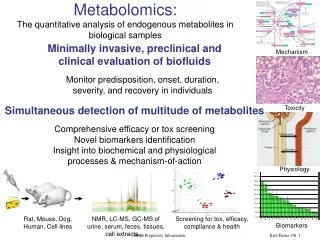
Spectroscopic Analysis for biological samples : towards in situ sample analysis of body fluids. Gilwon Yoon September 27, 2006 Seoul National University of Technology. Spectra of water, Hb(RBC), albumin, glucose from visible to NIR (water compensated). Absorption spectrum of water.

E N D
Spectroscopic Analysis for biological samples : towards in situ sample analysis of body fluids Gilwon Yoon September 27, 2006 Seoul National University of Technology
Spectra of water, Hb(RBC), albumin, glucose from visible to NIR (water compensated)
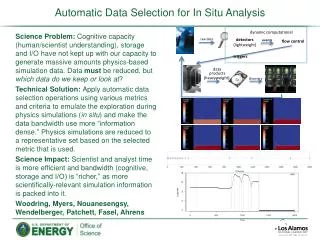
Interfering substances Light interaction with tissue Visible/IR Spectroscopic detection Light source High S/N electronic detection target component inhomogeneous medium Chemometrics Prediction of concentration Statistical analysis Clinical test Involved Key Technologies
Spectroscopic Analysis – Statistical Methods • Influence of measurement setup : Transmission or reflection measurement • Influence of red blood cell (hemoglobin) in partial least squares regression (PLSR) analysis • Independent Component Analysis (ICA) – a method without calibration process
slit Light source Mono-chromator Detector Detector Sample (a) (b) I. Influence of measurement setup : Transmission or reflection measurement
Comparison between reflectance and transmittance Jeon, Hwang, Hahn, Yoon (2006), 11:1:014022, Journal of Biomedical Optics
Diffuse reflectance between 1100 and 1850 nm (a) SECV with respect to the optimal number of factor, (b) Loading vector of calibration model, (c) Regression vector of calibration model, (d) Prediction of glucose illustrated with the intralipid concentrations of sample solutions.
Diffuse transmittance with 1 mm thick samples (a) SECV with respect to the optimal number of factor, (b) Loading vector of calibration model, (c) Regression vector of calibration model, and (d) Prediction of glucose concentrations.
II. Influence of red blood cell (hemoglobin) in partial least squares regression (PLSR) analysis Biological Samples in the near infrared (1000 – 2500 nm) • Absorption becomes much stronger towards longer wavelengths • Dominance of hemoglobin • Interferences among the substances in blood or extracellular fluid • Effect of preprocessing methods
a) Whole blood spectra of 98 samples and saline spectrum, b) Whole blood spectra are correlated with hemoglobin and glucose concentrations at each wavelength and computed correlations coefficients are shown.
What is a maximally achievable accuracy ? Kim and Yoon (2006), 11: 041128, Journal of Biomedical Optics The standard error of glucose prediction was 25.5 mg/dl and the coefficient of variation in prediction was 11.2%.
III. Independent Component Analysis (ICA) –method without calibration process • Identification of pure, or individual, absorption spectra of constituent components from the mixture spectra without a priori knowledge of the mixture. • This method was tested with a two-component system consisting of aqueous solution of both glucose and sucrose, which exhibit distinct but closely overlapped spectra. • ICA combined with principal component analysis was able to identify a spectrum for each component, the correct number of components, and the concentrations of the components in the mixture. This method does not need calibration process. Hahn and Yoon (2006), in print, 45:32, November, Applied Optics
Pure, or individual, water-subtracted absorption profiles of Glucose (G) and Sucrose (S)
25 measured mid-IR spectra for the mixtures of glucose and sucrose. Water absorption was subtracted to enhance the absorption profile of each component.
Extracted pure-component spectra from measured IR spectra of 25. ‘Pure’ and ‘ICA’ represent pure-component absorption spectrum and the ICA-method extracted absorption spectrum respectively.
Scatter plot for the reference concentrations and ICs from measured mid-IR spectra
Summary in Spectroscopic analysis • Measurement geometry or setup – loading factor analysis can provide actual contribution of wavelength in prediction • Dominant absorber such as RBC(hemoglobin) and water in near infrared effect substantially. A proper care is needed. • A new method that does not require no concentration information and calibration process is introduced.