Download
1 / 9
90 likes | 366 Views
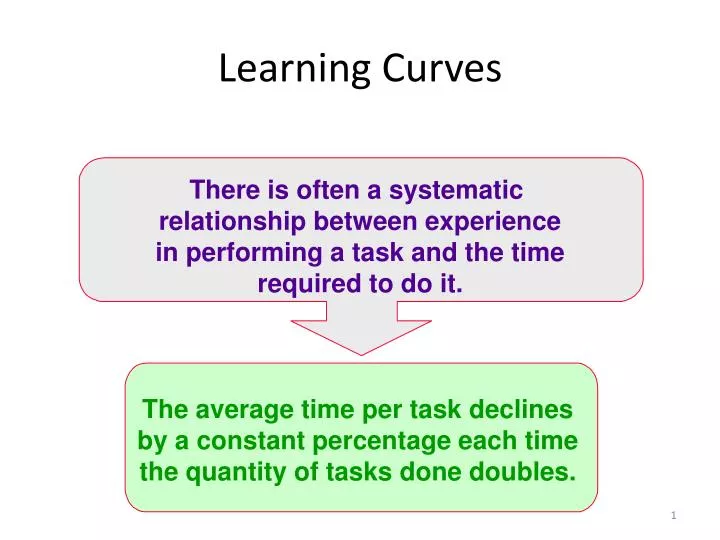
Learning Curves. There is often a systematic relationship between experience in performing a task and the time required to do it. The average time per task declines by a constant percentage each time the quantity of tasks done doubles. Types of Learning Curves.

E N D
Learning Curves There is often a systematic relationship between experiencein performing a task and the timerequired to do it. The average time per task declines by a constant percentage each time the quantity of tasks done doubles.
Types of Learning Curves • Cumulative Average-Time Learning Model – cumulative average time per unit declines by a constant percentage each time the cumulative quantity of units produced doubles • Incremental Unit-Time Learning Model – incremental time needed to produce the last unit declines by a constant percentage each time the cumulative quantity of units produced doubles
Effect of Learning on Cost Behavior Berry Co. makes products requiring labor that follows an 80 percent learning rate. If the first unit of such a product requires 10 hours, what is the average time for 16 units of this product? An 80 percent learning rate:the average time required to make 2 units is 80 percent of the time for 1 unit and the average time for 4 units is 80 percent of the time for 2 units, etc.
Cumulative Average-Time Learning Model The graphic presentation of the learning phenomenon is called the learning curve.
Learning Curve Learning effectsare large initially. Learning effectsbecome smaller, eventually reaching expected final time. Average LaborTime per Unit Cumulative Production Output
This is used to help determine investment required. This is used to estimate ongoing results. Average LaborTime per Unit Cumulative Production Output
Question for Discussion 2 • Time to produce the first unit = 100 minutes • Learning factor = ln(0.80)/ln2 = -0.32193 • What is the cumulative average time to produce 5 units? • What is the total time to produce 5 units? • What is the time it took to produce the 5th unit?
Incremental Unit-Time Learning Model Using the example of Berry Co. and using the incremental unit-time learning model