Download
1 / 10
100 likes | 212 Views
Learning Curves. Stephen R. Lawrence Associate Professor of Operations Leeds School of Business University of Colorado Boulder, CO 80309-0419. Stephen.Lawrence@Colorado.edu Leeds.colorado.edu/faculty/lawrence. Learning Curves.

E N D
Learning Curves Stephen R. LawrenceAssociate Professor of Operations Leeds School of Business University of Colorado Boulder, CO 80309-0419 Stephen.Lawrence@Colorado.edu Leeds.colorado.edu/faculty/lawrence
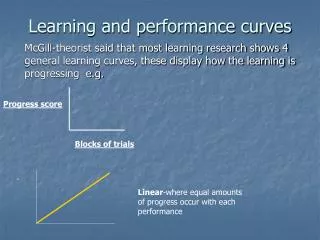
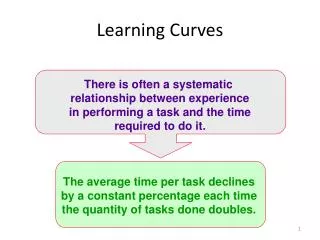
Learning Curves • As experience increases, costs decline. For each doubling of cumulative unit production, costs decrease by some percentage • Learning on the part of labor (methods improvement) • Changes in production methods and tools • Improved product design • Changes in layout and process flow • Standardization
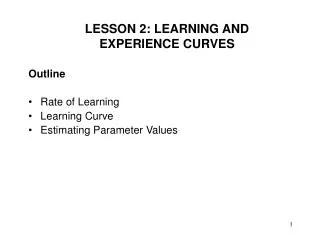
Learning Curve Model kn = k1 n b n = cumulative unit outputkn=cost of the nth item k1= cost of the first item r = rate of learning b = learning parameter b = log r / log 2
Example: Learning Curves Consider two start-up firms making similar new products. If firm A produces at twice the rate of firm B, what will be the relative costs of the two firms after 2 years? k1= $100 per unit (both firms) r= 0.8 (80 percent learning curve) nA = 1000 (after two years) nB= 500 (after two years) First – find b: r = 0.8 b = log r / log 2 = log 0.8 / log 2 = 0.0969 / 0.301 = -0.3219
Example: Learning Curves Consider two start-up firms making similar new products. If firm A produces at twice the rate of firm B, what will be the relative costs of the two firms after 2 years? k1= $100 per unit (both firms) b = -0.3219 (80 percent learning curve) nA= 1000 (after two years) nB= 500 (after two years) k1000 = k1 nAb = 100 (1000) -0.3219 = $10.82 / unit k500 = k1 nBb = 100 (500) -0.3219 = $13.53 / unit Firm 1 will have a 25% cost advantage over Firm 2 !
Competing with Learning Faster learning means lower costs and competitive advantage Costper Unit Slower Learning Faster Learning Number of Units Produced
Competing with Learning Faster learning can offset initial cost disadvantages Costper Unit Number of Units Produced
Competing with Learning Faster learning can offset a late market start Costper Unit Number of Units Produced
Learning Curves:Another Example Your snow board manufacturing company is taking off and has received an order for 80 boards of a new design. The first board took 46 hours to produce (!), but you are learning quickly, and the 10th board took only 24 hours to produce. What is your rate of learning? How many hours do you estimate the 80th board will take to manufacture?