Download
1 / 29
380 likes | 949 Views
OM2. SUPPLEMENTARY CHAPTER A. WORK MEASUREMENT, LEARNING CURVES, AND STANDARDS. DAVID A. COLLIER AND JAMES R. EVANS. Supp. Chapter A. Learning Outcomes. l e a r n i n g o u t c o m e s. LO1 Explain the purpose of work measurement. LO2 Describe how to apply time study methods.

E N D
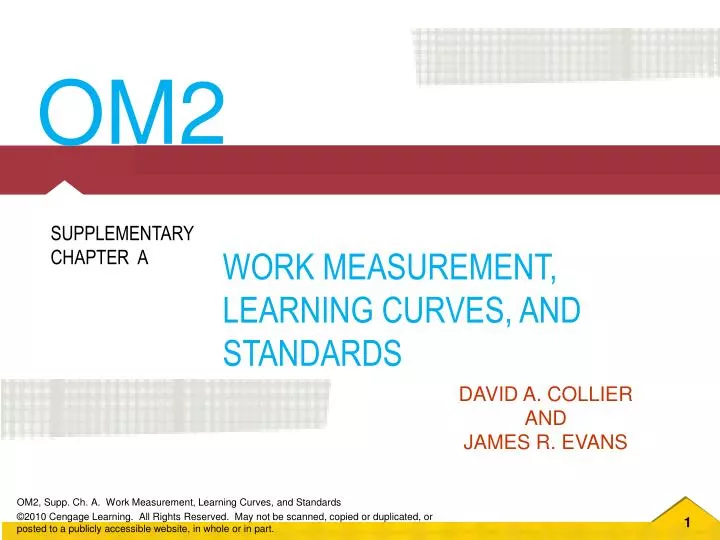
OM2 SUPPLEMENTARY CHAPTER A WORK MEASUREMENT, LEARNING CURVES, AND STANDARDS DAVID A. COLLIER AND JAMES R. EVANS
Supp. Chapter A. Learning Outcomes l e a r n i n g o u t c o m e s LO1Explain the purpose of work measurement. LO2Describe how to apply time study methods. LO3Explain the principles and calculation methods of work sampling. LO4Explain the concept of a learning curve and their application for estimating production times.
Supp. Chapter A. Work Measurement, Learning Curves, and Standards j im, it takes 2,000 hours to build each electrical generating turbine, so if we have to build ten, it takes 20,000 hours. We should plan our budget and price per generator based on 20,000 hours,” exclaimed Pete Jacobs, the vice president of finance. “No, Pete. According to my calculations, it will take only 14,232 hours to build ten turbines and our total cost and budget will be much lower than you think,” said Jim Conner, the vice president of operations. “How do you get such crazy numbers?” replied Jacobs.
Supp. Chapter A. Work Measurement, Learning Curves, and Standards What do you think? Have you had an experience in which the time it took to perform some activity (such as solving a Sudoku puzzle or playing an X-box game) improved as your learning increased?
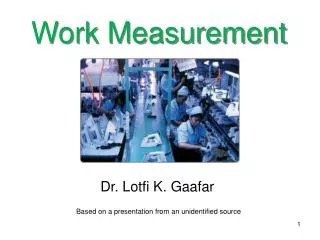
Supp. Chapter A. Work Measurement, Learning Curves, and Standards Time standardsrepresent reasonable estimates of the amount of time needed to perform a task based on an analysis of the work by a trained industrial engineer or other operations expert. Work measurement is a systematic procedure for the analysis of work and determination of times required to perform key tasks in processes. Work measurement leads to the development of labor and equipment time standards.
Supp. Chapter A. Work Measurement, Learning Curves, and Standards • Uses of Time Standards • Estimating work-force and equipment capacity • Establishing budgets • Determining what new work procedures will cost • Evaluating time and cost trade-offs among process design alternatives • • Establishing wage-incentive systems • • Monitoring and evaluating employee performance and productivity, and • • Providing accurate information for scheduling and sequencing
Supp. Chapter A. Work Measurement, Learning Curves, and Standards • Normal Time • Normal time is the expected time required to perform some work activity at a normal pace, under normal operating conditions, and using a prescribed method. • Normal time = • Observed time x Performance rating factor • = OT x PRF
Supp. Chapter A. Work Measurement, Learning Curves, and Standards Calculating Standard Time Allowances include time for labor fatigue and personal needs, equipment breakdowns, rest periods, information delays, and so on. Standard time is normal time adjusted for allowances. Standard time = Normal time (1 + Allowance factor)
Supp. Chapter A. Work Measurement, Learning Curves, and Standards • Time Study Methods • Time study is the development of a standard time by observing a task and analyzing it with the use of a stopwatch.
Supp. Chapter A. Work Measurement, Learning Curves, and Standards Time Study Approach 1. Define and evaluate each activity. 2. Measure and record the time needed to perform each task or activity over a number of cycles. Number of cycles: n ≥ (za/2)2σ2/E2 where za/2is the value of the standard normal distribution having an area of a/2 in the upper tail, σ is an estimate of the standard deviation, and E is the desired sampling error.
Supp. Chapter A. Work Measurement, Learning Curves, and Standards Time Study Approach 3. Rate the employee’s performance of each task or activity. 4. Use the performance rating and equation A.1 to determine the normal task time. 5. Determine the allowance factor for the work activity. 6. Determine the standard time.
Exhibit A.1 Faucet Stem Assembly Example
Exhibit A.2 Operations Activity Chart of Faucet Stem Assembly
Supp. Chapter A. Work Measurement, Learning Curves, and Standards Work Activities 1. Get housing and stem. 2. Screw in stem. 3. Get and insert washer. 4. Get and insert screw. 5. Tighten screw. 6. Place completed assembly in tray.
Supp. Chapter A. Work Measurement, Learning Curves, and Standards • Sample Size • Suppose we desire a 90 percent probability • that the value of the sample mean provides • a sampling error of .01 minute or less. • Assume that σ is estimated from historical • experience to be .019. • Therefore, a = .10, z.05 = 1.645, and • E = .01. • n =(1.645)2(.019)2/(.01)2 = 9.8 or • 10 observations
Exhibit A.3 A Spreadsheet for Time Study Time Study Spreadsheet
Supp. Chapter A. Work Measurement, Learning Curves, and Standards • Regression Analysis for Standard Times • Regression analysis is used to predict times based on different attributes of the work, rather than by adding up individual task times. • Advantages • avoids the assumption of additive task times when this might not hold; • statistically significant variables can be determined; • confidence intervals for the prediction can be developed; and • it may cost less than a detailed work study.
Supp. Chapter A. Work Measurement, Learning Curves, and Standards Example Time = 0.237 + 2.804 Poles + 0.514 Wire + 1.09 Cross arms + 0.170 Insulators + 1.50 Guy wires
Supp. Chapter A. Work Measurement, Learning Curves, and Standards Predetermined Time Standard Methods Predetermined time standards describe the amount of time necessary to accomplish specific movements (called micromotions), such as moving a human hand a certain distance or lifting a 1-pound part. Advantages: cost less than a stopwatch time study, avoid needing multiple performance ratings, and are best for new goods and services. Disadvantages: not justified for small order sizes or production runs, assumption of additivity may be questionable.
Supp. Chapter A. Work Measurement, Learning Curves, and Standards Work Sampling Work sampling is a method of randomly observing work over a period of time to obtain a distribution of the activities that an individual or a group of employees perform. Sample size: n ≥ (za/2)2p(1 - p)/E2 where p is an estimate of the population proportion
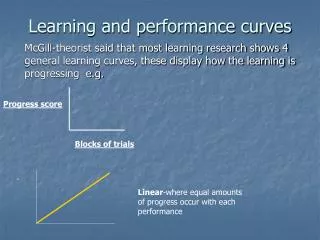
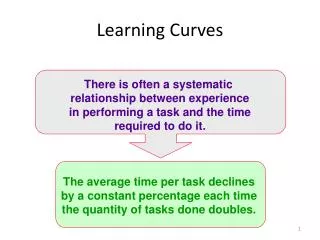
Supp. Chapter A. Work Measurement, Learning Curves, and Standards • Learning Curves • The learning curve concept is that direct labor unit cost decreases in a predictable manner as the experience in producing the unit increases. • A p-percent learning curve characterizes a process in which the time of the 2xth unit is p percent of the time of the xth unit.
An 80 Percent Learning Curve Exhibit A.6
Supp. Chapter A. Work Measurement, Learning Curves, and Standards Learning Curve Calculations y = ax-b where x = number of units produced, a = hours required to produce the first unit, y = time to produce the xth unit, and b = constant equal to -ln p/ln 2 for a 100p percent learning curve.
Supp. Chapter A. Work Measurement, Learning Curves, and Standards • Example • 90 percent learning curve • Time to produce first unit is 3,500 hours • Learning curve function: y = 3500x-0.152 • Time to manufacture second unit • = 3500(2)-0.152 = 3150 hours
Supp. Chapter A. Work Measurement, Learning Curves, and Standards Experience Curve The experience curve states that the cost of doing any repetitive task, work activity, or project decreases as the accumulated experience of doing the job increases.
Supp. Chapter A. Work Measurement, Learning Curves, and Standards Practical Issues With Learning Curves 1. The learning curve does not usually apply to supervisory personnel, some skilled craftspeople, or jobs that have nonrepetitive job tasks. 2. A change in the ratio of indirect labor or supervisory talent to direct labor can alter the rate of learning. 3. The institution of incentive systems, bonus plans, quality initiatives, empowerment, and the like may increase learning. 4. Changes in product design, raw material usage, technology, and/or the process may significantly alter the learning curve.
Supp. Chapter A. Work Measurement, Learning Curves, and Standards Practical Issues With Learning Curves 5. Humans learn simple task(s) quickly and reach a limit on learning for the task(s), but for complex intellectual task(s) such as software programming, learning is less limited and may continue. The first type of learning is described with an exponential curve; the more complex learning is sometimes described by an S-shaped curve. 6. A contract phase out may result in a lengthening of processing times for the last units produced, since employees want to prolong their income period.
Supp. Chapter A. Work Measurement, Learning Curves, and Standards Practical Issues With Learning Curves 7. The lack of proper maintenance of tools and equipment, the nonreplacement of tools, or the aging of equipment can have a negative impact on learning. 8. Keeping groups of employees together, such as highly specialized consulting groups, reaps a productivity benefit but may stifle innovation and new experiences. 9. The transfer of employees may result in an interruption or a regression to an earlier stage of the learning curve or may necessitate a new learning curve. 10. Learning curves focus on direct labor and ignore indirect labor that also contributes to efficiency and effectiveness.
Supp. Chapter A. Work Measurement, Learning Curves, and Standards • The State Versus John Bracket Case Study • a. Whose case is justified—Davis or Bracket? Explain. • b. What other issues should be considered? • c. Would you present these data in court? Why or why not? • d. What are your final recommendations?