Download

1 / 14
140 likes | 146 Views
A Nonlinear Mapping for Data Structure Analysis. John W. Sammon, Jr., IEEE Transaction on Computers, Vol. C-18, No. 5, 1969, pp. 401-409. Presenter : Wei-Shen Tai Advisor : Professor Chung-Chian Hsu 200 7 / 4/4. Outline. Introduction Nonlinear mapping Some computer results

E N D
A Nonlinear Mapping for Data Structure Analysis John W. Sammon, Jr., IEEE Transaction on Computers, Vol. C-18, No. 5, 1969, pp. 401-409. Presenter : Wei-Shen Tai Advisor : Professor Chung-Chian Hsu 2007/4/4
Outline • Introduction • Nonlinear mapping • Some computer results • Relationship of NLM to other structure analysis algorithm • Limitations and extensions • Comments • MDS
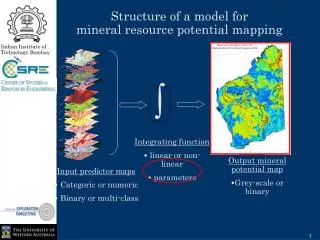
Motivation • Data structure visualization • Provide a highly effective visualization method in the analysis of multivariate data. • Data structure refers to geometric relationships among subsets of the data vectors in the L-space.
Objective • Nonlinear mapping algorithm (NLM) • Based upon a point mapping of the NL-dimensional vectors from the L-space to a lower dimensional space such that the inherent structure of the data is approximately preserved under the mapping.
Nonlinear mapping • N vectors in an L-space designated Xi, i= 1, …, N and corresponding to these we define N vectors in a d-space (d = 2 or 3) designated Yi, i=l, …, N. • Let the distance between the vectors Xi and Xj in the L-space be defined by dij*=dist [Xi, Xj] and the distance between the corresponding vectors-Yi and Yj in the d-space be defined by dij= dist [Yi, Yj]. • A steepest descent procedure to search for a minimum of the error
19-dimensional Gaussian simplex distribution Fig 7. result of principle eigenvector plots Fig 6. result of NLM
Experiments in document classification • A document classification space • Every document in the library was represented as a 17-dimensional vector. All of them are described a mapping of 1125 preselected words and phrases into the C-space. • Query 1 ~ 5 and their related documents are shown, respectively. • Documents considered relevant to a given request were clustered. • Documents tend to be uniformly distributed throughout the space. • Clusters 2 and 3 tend to overlap, yet they are well-separated from clusters 4 and 5. In general, the intercluster relationships seem consistent with their respective subject relationships.
Relationship to other related algorithm • Multidimensional Scaling • Find a configuration of points in a t-space such that the resultant inter-point distances preserve a monotonic relationship to a given set of inter-element similarities (or dissimilarities). • Deficiencies • Resulting cluster configuration is highly dependent upon a set of control parameters which must be fixed by the user. • Particularly sensitive to hyper-spherical structure and are inefficient in detecting more complex relationships in the data. • Do not exist really good ways for evaluating a resultant cluster configuration. • When two clusters are close, the vectors between tend to form a bridge and cause spurious mergers.
Nonlinear mapping vantage • A highly promising structure analysis algorithm • None control parameters require a priori knowledge. • Highly efficient in identifying complex data structures. • Easy to detect and identify data structure. • Dealing extraneous data and spurious mergers. • Simple and efficient.
Limitation and extension • Limitations • Reliability of the scatter diagram in displaying extremely complex high-dimensional structure. • Minimum mapping error is too large (E>>0.1) and the 2-dimensional scatter plot fails to portray the true structure. • Number of vectors that it can handle. • Limited at present to N< 250 vectors. • When N> 250, we suggest using a data compression technique to reduce the data set to less than 250 vectors. • Extension • On-Line Pattern Analysis and Recognition System (OLPARS)
Comments • Advantage • A visualization method for hyper-space data. • The distance of data space can be preserved and interpreted in geometric relationship in the low-dimension map. • Drawback • Easy to learn and hard to compute. • The computational cost seems quite high. • Application • Data structure visualization related applications.
MDS • A very simple example, using mileage distances between cities. • Start with a map, which illustrates the relative geographic locations of a set of American cities. • The map is a geometric model in which cities are represented as points in two-dimensional space. The distances between the points are proportional to the geographic proximities of the cities. • Using the map/model it is easy to construct a square matrix containing the distances between any pair of cities. • The matrix, itself, is analogous to the mileage chart that is often included with road maps.
MDS algorithm • MDS uses the matrix of distances (i.e., the “mileage chart”) as input data. • The output from MDS consists of two parts: • A model showing the cities as points in space, with the distances between the points proportional to the entries in the input data matrix (i.e., a map). • A goodness-of-fit measure showing how closely the geometric point configuration corresponds to the data values from the input data matrix.