Download
1 / 13
150 likes | 498 Views
Nonlinear Analysis: Riks Analysis. Objective. Section 3 – Nonlinear Analysis Module 5 – Riks Analysis Page 2.

E N D
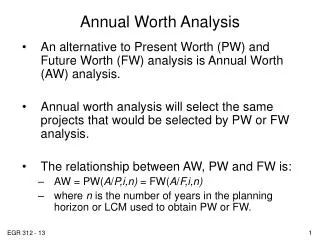
Nonlinear Analysis: Riks Analysis
Objective Section 3 – Nonlinear Analysis Module 5 – Riks Analysis Page 2 The objective of this module is to show how to determine the load at the onset of buckling and the displacement controlled post-buckling response using a Riks analysis in Autodesk Simulation Multiphysics. Elastic-plastic buckling of a shallow arch Load Factor Curve
Analysis of Unstable Systems Section 3 – Nonlinear Analysis Module 5 – Riks Analysis Page 3 Newton-Raphson Iterations • Standard Newton-Raphson based iterative methods use constant load increments, DF, and iterate to find the associated displacement increment, Dd. • These methods run into problems when instability associated with buckling is encountered. • As seen in the figure, there is not an equilibrium point for load increment DF5 and convergence cannot be achieved. F DF5 DF4 DF3 DF2 DF1 Dd1 Dd3 Dd4 d Dd2
Riks Methods Section 3 – Nonlinear Analysis Module 5 – Riks Analysis Page 4 Riks/Wempner Constraint Riks proposed adding an additional constraint (shown by the blue line in the figure) that limits the displacement increment and makes the magnitude of the load increment a variable. F DF5 DF4 DF3 DF2 DF1 Dd1 Dd3 Dd4 Dd4 d E. Riks, An Incremental Approach to the Solution of Snapping and Buckling Problems, International J. Solids& Structures, 15, 529 (1979). Dd2
Arc Length Methods Section 3 – Nonlinear Analysis Module 5 – Riks Analysis Page 5 Crisfield Constraint • Riks’ method led to a class of solution methods that use a hypersphere constraint. • These methods, called arc-length methods, are illustrated in the figure. • Arc-length methods are easier to implement into finite element programs than the original Riks method. F DF5 DF4 DF3 The constraint radius or arc-length is held constant during the analysis. DF2 DF1 Dd1 Dd3 Dd4 Dd4 d Dd2 M.A. Crisfield, A Fast Incremental Iterative Procedure that Handles Snap-Through, Computers & Structures, 13, 55 (1981).
Arc-length Section 3 – Nonlinear Analysis Module 5 – Riks Analysis Page 6 • In Simulation, an initial load increment is used to determine the magnitude of the hypersphere constraint. • This magnitude is held constant during the rest of the load increments. • The objective for each increment is to determine how much increase or decrease in the load is needed to make the displacements satisfy the hypersphere constraint equation. Typical Iterations R Constraint Surface (Typical) R
Load Factor Section 3 – Nonlinear Analysis Module 5 – Riks Analysis Page 7 • The load factor is a scalar multiplied by the external nodal forces to achieve equilibrium. • The load factor can increase, decrease and go negative during an analysis. • The load factor is printed in the analysis log file during a Riks Analysis using Autodesk SimulationMultiphysics software. Equilibrium Equation Unbalanced load vector. Equal to zero when equilibrium is achieved. Variable load factor Array of external forces Array of internal forces caused by displacement induced stresses Reference Section 2: Module 3 PowerPoint Slides
Example Problem Section 3 – Nonlinear Analysis Module 5 – Riks Analysis Page 8 • The elastic-plastic response of an arch will be determined using the Riks analysis type in Autodesk Simulation Multiphysics. • An elastic-plastic material model for AISI 1020 cold rolled steel is used. • The mesh uses two elements with mid-side nodes through the thickness to capture the through thickness stress gradients. 75 lbs divided among 15 nodes
Setting Up a Riks Analysis in Autodesk Simulation Multiphysics Section 3 – Nonlinear Analysis Module 5 – Riks Analysis Page 9 • Only a few parameters must be defined to run a Riks analysis. • The “Total number of steps” controls how long the analysis will run. • The “Initial load factor increment” defines the fraction of the load applied during the first load increment. • The displacements from this first increment are used to determine the arc-length used during the rest of the analysis. Trial and error is commonly used to determine values for these parameters that will achieve acceptable results.
Load Factor History Section 3 – Nonlinear Analysis Module 5 – Riks Analysis Page 10 • This plot shows the load factor computed for each load increment. • The results start to go non-linear at a load factor of 0.8, but the load factor continues to increase. • The peak load factor is 0.94 or 94% of the max load defined in the FEA Editor. • The wavering nature of the line is due to the size of the convergence tolerance used while seeking a converged solution. The elastic-plastic buckling strength of the arch is equal to 0.94 times the applied load.
Deformed Shapes Section 3 – Nonlinear Analysis Module 5 – Riks Analysis Page 11 • The arch progresses through a series of shapes during the event. • The amount of load that it can support continues to increase until load increment 20. • After load increment 20 the load factor decreases indicating that the arch has buckled. 0% Load 94% Load, Increment 20 77% Load, Increment 50 64% Load, Increment 75 55% Load, Increment 100
Snap Through Problems Section 3 – Nonlinear Analysis Module 5 – Riks Analysis Page 12 • The Riks method is able to handle snap through problems. • Snap through occurs when an elastic arch is loaded beyond its buckling load and snaps through to another shape where it can continue to carry an increase in load. • Snap through would have been encountered in the arch problem used in this example had the material not been elastic-plastic. Shallow Arch Original Shape Buckled Shape F d
Module Summary Section 3 – Nonlinear Analysis Module 5 – Riks Analysis Page 13 • This module has provided an introduction to concepts used in conjunction with a Riks analysis. • This static analysis method is used to determine the onset of buckling and the post-buckling response of structural systems. • The method seeks a load factor that will cause the displacements to lie on a hypersphere constraint surface. • It gives results similar to those obtained from a displacement controlled experiment. • In general, buckling is not a displacement controlled event and the true post-buckling response of the system must be computed using a full nonlinear dynamic analysis.