Download
1 / 24
240 likes | 265 Views
Chapter 19 The Inheritance of Complex Traits. Quantitative Genetics. Former basketball star Wilt Chamberlain (7 feet, 1 inch tall) and former renowned jockey Willie Shoemaker (4 feet, 11 inches tall) show some of the extremes in human height—a quantitative trait Quantitative traits Statistics

E N D
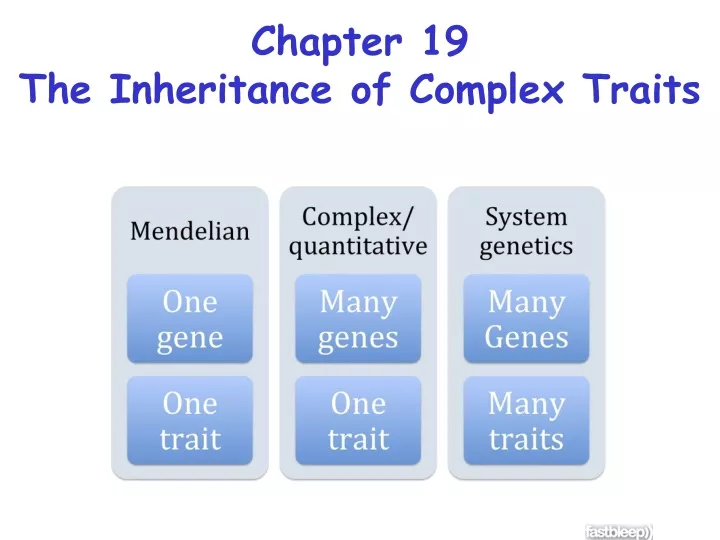
Chapter 19 The Inheritance of Complex Traits
Quantitative Genetics • Former basketball star Wilt Chamberlain (7 feet, 1 inch tall) and former renowned jockey Willie Shoemaker (4 feet, 11 inches tall) show some of the extremes in human height—a quantitative trait • Quantitative traits • Statistics • Phenotypic distributions • Reaction norms • Broad-sense heritability • Narrow-sense heritability • QTL mapping
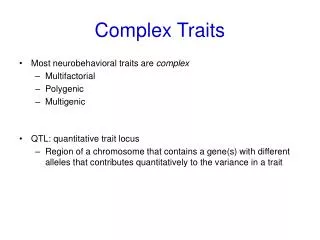
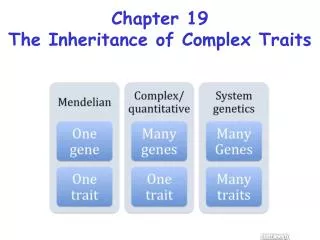
What is quantitative genetics? • Traits such as height that show a continuous range of variation and do not behave in a simple Mendelian fashion are known as quantitiative or complex traits • Calculation of a mean (average) value and variance/standard deviation • Quantitative trait loci (QTLs) produce continuously variable phenotypes
Basic statistical concepts • phenotypic variation in quantitative traits described statistically (frequency histogram) • features of statistical distributions: • central tendency (mean or average)—observed values around a particular point • dispersion (variance or standard deviation)—how much variation about the mean
Populations can be described mathematically -Mean of a population X= 1/n ΣX
Populations can be described mathematically -Variance of a population Vx= 1/n Σ (X –X)2 The standard deviation is the square root of the variance In a normal distribution, the standard deviation describes the distribution.
How can the relative contributions to Yao Ming’s height be determined? If we could clone Yao Ming and raise his clones in different environments, we could determine the relative contributions of genetics and environment.
What is quantitative genetics? • Correlates phenotypic trait distributions with genotypes, environment • Some questions researchers ask: • What proportion of observed phenotypic variation is determined by genetic variation? • What proportion of observed phenotypic variation is determined by environmental variation? • Do different alleles for a gene produce different effects? • What phenotypes of the genotypes inhabit different environments? • How many loci are involved for a trait? • What offspring result from crosses of different quantitative phenotypes?
Quantitative traits described by frequency distribution several genes? few genes? # genes partly determines curve“smoothness” many genes?
Reaction norm relates environment and phenotype • reaction norm = relation between environment and phenotype for a particular genotype • can graph this • under a “distribution of environments”, any given genotype yields a “distribution of phenotypes”
Reaction norm shows no genotype “best” for all environments
Reaction norm shows no genotype “best” for all environments • few reaction norm studies to date on quantitative traits of wild species • many on domesticated crops (e.g., corn, strawberries) • no genotype consistently produces “superior” phenotypes across all environmental conditions
Broad-Sense Heritability:Nature Versus Nurture • If trait is heritable, we can quantify heritability • We can separate total phenotypic variation of population (VX) into genetic variance (Vg) and environmental variance (Ve) • Broad-sense heritability (H2) is defined as H2 = Vg/VX • H2 varies from 0 (all environment) to 1 (all genetic)
Monozygotic twins are genetically identical
Narrow–Sense Heritability • understanding of broad-sense heritability (H2) useful, but may want to know more about genetic variance specifically • heterozygotes not exactly intermediate in phenotype between homozygotes (partial dominance) • difference in average effect between alleles is “additive effect” • accounts for some, but not all, variance in phenotype
Narrow-sense heritability • so, genetic variance (Vg) can be subdivided into additive genetic variation (Va) and dominance variance (Vd): Vg = Va + Vd • recall that total phenotypic variance (Vx) is Vx= Vg + Ve= Va + Vd + Ve • so, narrow-sense heritability (h2) is defined as: h2 = Va/Vx
Estimating components of genetic variance • allows us to use h2 to predict effects of artificial selection • Animal and plant breeders use h2
Different populations have different heritabilities for traits
QTL Mapping Mapping quantitative loci requires: Setting up a cross that will result in a segregating population Developing assays for a large number of molecular markers in the organism Assaying for correlation between the trait in question and the molecular markers in offspring
Summary • reaction norm studies show that no single genotype “superior” over all environments • broad heritability (H2) separates genotypic from environmentally induced variance: H2 = Vg/Vx • narrow heritability (h2) subdivides genetic variance into additive and dominance variance: h2 = Va/Vx • can use h2 to predict effects of artificial selection • can use various two mapping approaches to determine the genetic basis of quantitative traits • many traits have many contributing loci, each usually providing small effects