Download
1 / 17
170 likes | 404 Views
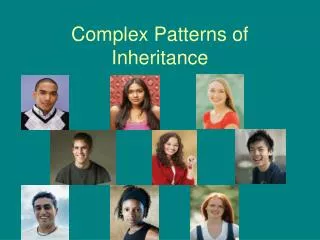
Complex patterns of inheritance Chapter 13. Pedigrees. Tracking Family History. Pedigrees. A chart that shows multiple family generations and relationships to track the inheritance of genetic traits. Pedigrees. Can be used to determine genotypes of family members .

E N D
Pedigrees • Tracking Family History
Pedigrees • A chart that shows multiple family generations and relationships to track the inheritance of genetic traits.
Pedigrees • Can be used to determine genotypes of family members. • Can be used to help predict probability of future generations expressing certain traits. • Important tool for genetic counselors
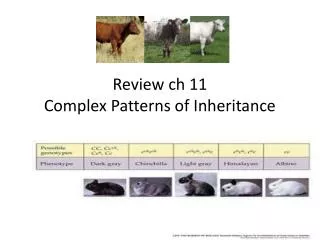
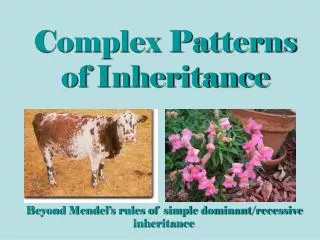
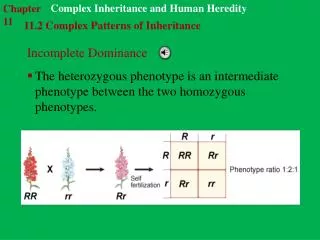
Phenotype and allele interaction • Incomplete dominance – dominant & recessive traits are blended • Example: Four o’clock flower color – red, white, pink • Remember: Vegetable juice
Phenotype and allele interaction • Codominance – dominant & recessive traits both show up completely and individually • Example: Blood types A & B, Horse coat color • Remember: Salad & cows
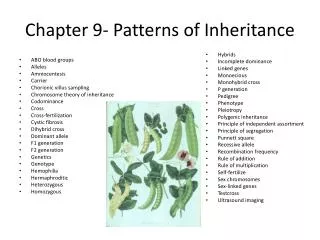
Phenotype and allele interaction • Multiple alleles - More than 2 alleles control the phenotype • Example: blood types A, B, O, eye color
Phenotype and Gene interaction • Polygenic traits – more than one gene controls phenotype • Examples: skin (4 genes), fingerprints
Phenotype and Gene interaction • Epistasis = one gene can interfere with the expression of another • Examples: mouse fur color (5 genes) – one gene overshadows the others Albanism – no pigment
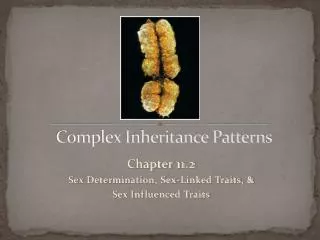
Environmental Interaction with Genotype • The environment can influence gene expression • Affects phenotype • Examples: • Sun exposure – affect s skin & hair color • Temperature – sea turtles produce more females in warm years and more males in cold years • Identical twins – nutrition, healthcare & physical activity influence appearance
Fingerprints • An individual’s fingerprints are controlled by polygenic inheritance, but also by the fetal environment. The ridge pattern of a fingerprint can be altered during weeks 6 – 13 of fetal development as the fetus touches the wall of the amniotic sac with its fingertips. • Identical twins who have identical genes have different fingerprints.
ABO Blood GroupingExample of Multiple-allele traits • There are three alleles to blood • Ai (antigen for A) • Bi (antigen for B) • Oi (antigen that can be changed called H) • Ai produces the antigen A found on the RBC and co dominate • Bi, antigen B, co dominate • Oi, recessive changing antigen
Blood Typeof Parents Possible Genotypesof Parents Possible Blood TypesAmong Children A and A Ai and Ai A and O A and B Ai and Bi A, B, AB, O A and AB Ai and AB A, B, and AB A and O Ai and ii A and O B and B Bi and Bi B and O B and AB Bi and AB A, B, and AB B and O Bi and ii B and O AB and AB AB and AB A, B, and AB AB and O AB and ii A and B O and O ii and ii O
Karyotype • During mitosis, the 23 pairs of human chromosomes condense and are visible with a light microscope. • A karyotype analysis usually involves blocking cells in mitosis and staining the condensed chromosomes with Giemsa dye, “G”. • The dye stains regions of chromosomes that are rich in the base pairs Adenine (A) and Thymine (T) producing a dark band. • These bands are not a single gene but represent hundreds of genes.
analysis involves comparing chromosomes • length • the placement of centromeres • the location and sizes of G-bands (stains)