Download
1 / 13
130 likes | 272 Views
Assessing the Spatial Pattern of Water Use in the Tucson Water Service Area. Akitsu Kimoto and Evan Canfield: Pima County Regional Flood Control Tom Arnold: Tucson Water. Background. City of Tucson/Pima County Water Study Joint Effort for Sustainable Water Resource Planning

E N D
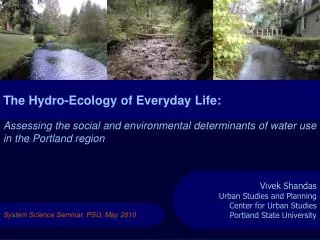
Assessing the Spatial Pattern of Water Use in the Tucson Water Service Area Akitsu Kimoto and Evan Canfield: Pima County Regional Flood Control Tom Arnold: Tucson Water
Background • City of Tucson/Pima County Water Study • Joint Effort for Sustainable Water Resource Planning • Core Elements: Water Supply, Demand Management, Comprehensive Integrated Planning, Respect for Environment • Understanding Water Use Patterns is basic to address Demand Management, so the study had three focus areas: • Construction Pattern Changes and Water Use at a Parcel Scale • Per-Household Water Use Study • Per-Capita Water Use Study • Spatial Pattern of Water Use at a Subdivision Scale • Subdivision Water Use Study
Outline • Objective: Assess Water Use at a Subdivision Scale within Tucson Water Service Area. • We evaluated…. • Spatial patterns of subdivision water use • Spatial pattern of household size • Property value, area and subdivision water use • Variability of water use within an individual subdivision.
Data Used • Spatial Datasets (Pima County GIS library) • Parcel data • Subdivision data • Tucson Water Service Area boundary • Census Block 2010 data • Tabular Data • MAS 2011 (Pima County Assessor’s Office data) • Monthly water use data from 2009 and 2010 (Tucson Water) • Parsed Study Dataset • Removed parcels with a month of no water use • Used parcels with homes built before 2008 (“normal” level of water demand established) • Used subdivisions consisting of 100% single family residences (i.e. no multi-family residences) • Final dataset includes~ 70,000 residential customers in 1,200 subdivisions
Average Household Size (Number of People living in a House – 2010 Census) Southern and Southwestern Tucson: Larger Household Size
Average Household Monthly Water Use at Subdivision Scale (1 Ccf = 748 gals) Foothills: High Water Use High Low Central and Southern Tucson: Lower Water Use
Average Per-Capita Daily Water Use in Subdivision (GPCD) Foothills: High Water Use High Southern and Southwestern Tucson: Lower Water Use Lower Per-Capita Water Use in Southern/Southwestern Tucson can be related to the Larger Household/Newer, More Efficient Homes Low
Property Area, Property Value and Water Use Water use increasing with both parcel area and property value Best Fit with Logarithmic Line; Level off with increasing parcel area Best Fit with Liner Line; Stronger Fit than Parcel Area
Variability of Water Use within a Subdivision Example: Newer Subdivision constructed since 2000 77% of Homes are within this range Mean: 5454 sq ft SD: 941 Similar Sized Homes
Findings of the Study • Household size: • Large: southern and southwestern Tucson (More People live in Newer and More Efficient Homes) • Average per-household water use: • High: Foothills (often over 20 Ccf [15,000 gal/mo]) • Low: Central, Southern and Southwestern Tucson, (often less than 7.5 Ccf [~6000 gal/mo]) • Average per-capita water use: • High: Foothills (up to 300 GPCD) • Low: Southern and Southwestern Tucson (sometimes less than 50 GPCD) • Water use increases with both parcel area and property value. • A stronger relationship between property value and water use. • High variability in water use within a subdivision, even if the subdivision is similar in parcel area and house size (~30 GPCD to 130 GPCD).
Questions, Contacts and Resources • Contacts • Aktisu Kimoto akitsu.kimoto@pima.gov • Evan Canfield evan.canfield@pima.gov • Tom Arnold tom.arnold@tucsonaz.gov • City of Tucson – Pima County Water Study • http://tucsonpimawaterstudy.com/ • Report to be posted in next week or two