Download
1 / 8
80 likes | 219 Views
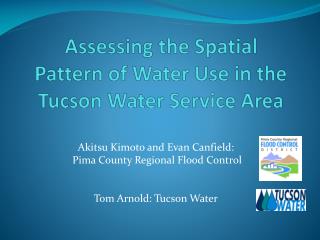
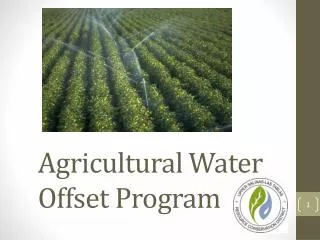
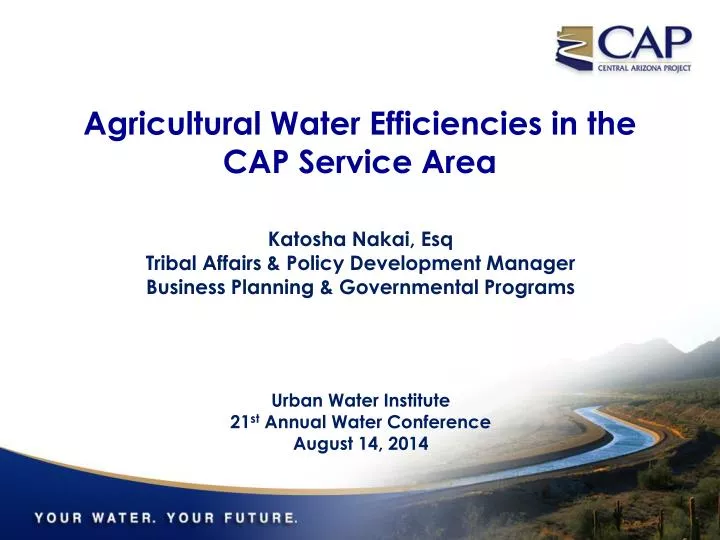
Agricultural Water Efficiencies in the CAP Service Area. Katosha Nakai, Esq Tribal Affairs & Policy Development Manager Business Planning & Governmental Programs. Urban Water Institute 21 st Annual Water Conference August 14, 2014. Basin Map. Groundwater Management Act.

E N D
Agricultural Water Efficiencies in the CAP Service Area Katosha Nakai, Esq Tribal Affairs & Policy Development Manager Business Planning & Governmental Programs Urban Water Institute 21st Annual Water Conference August 14, 2014
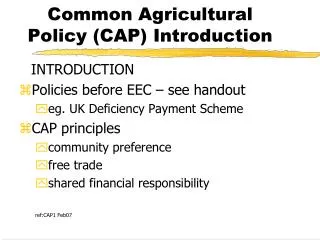
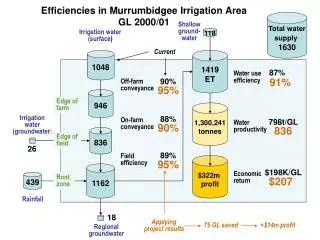
General Central AZ Ag Conservation Requirements • Irrigation district distribution losses not to exceed 10% • Base Program: Limitations on annual groundwater allotments, per farm, based on irrigation efficiencies of 65-80% • Best Mgt. Practices Program: Alternative to Base Program using a point system per farm
HDR Study Findings • 93.5% of the irrigated acres use irrigation technology that can achieve or exceed 80% irrigation efficiency • Water losses well below 10% since 1985 • -3% in recent years • An estimated $750 Million invested • -$3,700/acre • lined systems • automated controls • automated scheduling • real-time operations • real-time instrumentation (which reduce or eliminate spills) • crop rotations • laser technology to grade land • level Basin Irrigation • tailwater re-use
2016 Level 1 Shortage 1.5 MAF Other Excess (Shorted) 75,000 320,000 Low Ag Pool 400,000 Ag Pool (Shorted) 245,000 Ag Pool155,000 1.0 MAF NIA Priority 215,000 CAP Delivery Priority Indian Priority 317,000 M&I Priority 465,000 0.5 MAF High Priority 368,400 0 MAF
Questions Katosha Nakai, Esq Tribal Relations & Policy Development Manager 623-869-2620 knakai@cap-az.com