Download
1 / 12
120 likes | 269 Views
A JOINT PROJECT OF MISSISSIPPI STATE UNIVERSITY AND the Lower Mississippi River Forecast Center PROJECT FUNDED BY NOAA/OAR THROUGH THE NORTHERN GULF INSTITUTE Presented by David Welch LMRFC Development and Operations Hydrologist Saturday, October 4, 2014.

E N D
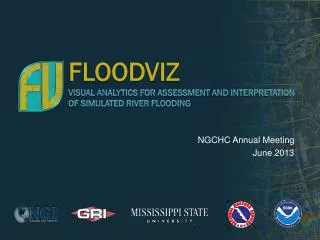
A JOINT PROJECT OF MISSISSIPPI STATE UNIVERSITY AND the Lower Mississippi River Forecast Center PROJECT FUNDED BY NOAA/OAR THROUGH THE NORTHERN GULF INSTITUTE Presented by David Welch LMRFC Development and Operations Hydrologist Saturday, October 4, 2014 Visualizing Analytics for Assessment and Interpretation of Simulated River Flooding
Today’s Discussion • Team Members • Project proposal • General philosophy • Project plan and requirements • Initial Study Area • Timeline • LMRFC status/plans • Issues and opportunities
MSU Staff LMRFC Staff Project Team • Dr. Phil Amburn - Research Associate Professor GRI (Project PI) • Dr. Robert Morehead - Professor of Electrical and Computer Engineering • Dr. Jamie Dyer - Asst Professor Geosciences Department (previously at SERFC) • Derek Irby • John van der Zwaag • Dave Reed (PI) • David Welch – DOH • David Ramirez – HEC-RAS leader • Jeff Graschel – SCH Assistance from • NWS OHD • Deltares/Delft-hydraulics • USACE HEC
Project Proposal • Specific goal - the development of visual analytics tools to enable scientists and forecasters to better interpret and distribute hydrologic information. • In plain language – develop tools to assist forecasters in evaluating the hydrology and hydraulics in forecast preparation and make inundation maps in real-time to support flood forecast operations. • Funding provided to NGI and LMRFC.
RFC Mapping Opportunity • NWS RFCs are migrating from FLDWAV-DWOPER to HEC-RAS with implementation of the Community Hydrologic Prediction System (CHPS). • HEC-RAS models allow development of georeferenced models with high resolution datasets. • Will have the data available to generate real-time inundation maps. • Will help meet a long term request from NWS customers .
Application Design Requirements • Coding to be easily transportable to other NWS field offices. • Use open source tools and libraries compatible with NWS AWIPS system. • Coding in Linux and Java to be platform independent. • Developed as a standalone application compatible with HEC-RAS on AWIPS and eventually linked to CHPS. • Be compatible with current NWS efforts in inundation mapping, HEC-RAS and CHPS.
Application Design Features • Plan view inundation maps with map tool set (zoom, pan, identify, mouse over depths). • River profile view or cross section (animated). • Selectable overlays (imagery, terrain, cultural features). • Ability to visualize animated time series, max water surface elevation, other hydraulic variables. • Run as an interactive forecast tool in real-time or in batch mode for graphic generation. • Output georeferenced data formats (shapefile, ascii grid, jpeg, gif, tiff, KML/KMZ). • Test 3-D animations.
Pascagoula River Study Area Study Area • Developed from LIDAR and USGS seamless 10m data. • Bathymetry from University of Central Florida ADCIRC grid derived with USGS cross sections, USACE MOB hydrographic surveys. • Stage/flow upstream boundaries. • NOS tide and SLOSH/ADCIRC hydrograph as downstream boundary. • Models the interface between land and sea.
Project Timeline • Fall, 09 • Hardware/Software procurement – • HEC-RAS development – LMRFC work ongoing • Winter, 09 – MSU to Develop prototype GUI and HEC-DSS readers • Summer, 10 – Provide alpha version of software to LMRFC for testing • Winter, 11 – Beta version of software to LMRFC and others for testing • Host mapping results on MSU website • Summer, 11 - Update software based on user feedback • Quarterly Meetings - Continual feedback and coordination between MSU and LMRFC
Flood Mapping Plans • Pascagoula HEC-RAS model development about 70 % complete. • Calibration and validation of inundation mapping results with historical floods (Spring 2009 and Katrina) • Coordination with MSU, HEC, OHD and Deltares/Delft on software development. • MSU Post Doctoral study on the visualization and mapping of uncertainty analysis.
Issues/Opportunities • Developing this as an analysis tool not just a tool to create inundation maps . • Opportunity to practice migration of research to operations. • Dissemination of data to end users. • Inundation mapping needs versus reality. • Education of end user to the limitations of the product. • Linkage with HEC – Linux tools that are in the Windows version of HEC-RAS?