Download
1 / 6
70 likes | 208 Views
NGCHC Annual Meeting June 2013. FloodViz Visual Analytics for Assessment and Interpretation of Simulated River Flooding. FloodViz. Motivation:

E N D
NGCHC Annual Meeting June 2013 FloodVizVisual Analytics for Assessment and Interpretation of Simulated River Flooding
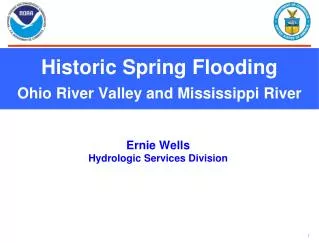
FloodViz • Motivation: • Need for better (i.e., more efficient and robust) tools to assist operational river forecasters in evaluating hydrologic and hydraulic properties of river discharge. • Need for a platform for rapid assessment and interpretation of hydraulic model output (single run and ensemble). • Need for an improved real-time inundation mapping framework to support flood forecast operations. • Goal: • Development of visual analytic tools and methods to enable scientists and forecasters to better interpret and distribute hydrologic information.
FloodViz • Developed in cooperation with the Lower Mississippi River Forecast Center • Developed using open-source and cross-platform libraries • Qt, Boost, OpenGL, Mesa, GDAL/OGR, PROJ.4, ImageMagick • Linux, OS X, MS Windows • Compatible with NWS plans for AWIPS hardware and software • Data formats: • HEC-RAS output • Digital elevation models (DEM) • Geo-referenced imagery • Shape Files • Interactive and batch visualization
Screenshots Plan View 3D View • Multiple views with interactive capabilities: • Numerous instances of views open at once. • Interaction between view types. • Flexible viewing environment and layout. • Dockable windows, multiple views, splitter windows. 3D View
Inundation Maps/Verification Visualization of HEC-RAS output vs MODIS image May 6, 2011
Future Plans • CHPS Integration • PI-XML communication with CHPS server • Batch Mode • Export of additional file types – KML, shapefile, etc. • Extend ensemble capabilities