Download

1 / 18
190 likes | 437 Views
Introduction to Conjoint Analysis . Different Perspectives, Different Goals. Buyers: Most desirable features & lowest price Sellers: Maximize profits by: 1) minimizing costs of providing features 2) providing products that offer greater overall value than the competition.

E N D
Different Perspectives, Different Goals • Buyers: Most desirable features & lowest price • Sellers: Maximize profits by: 1) minimizing costs of providing features 2) providing products that offer greater overall value than the competition
Demand Side of Equation • Typical research: focus on demand • Establish buyers wants/needs • Assess if it can be built/provided in a cost- effective manner
Products/Services are Composed of Features/Attributes • Credit Card:Brand + Interest Rate + Annual Fee + Credit Limit • On-Line Brokerage:Brand + Fee + Speed of Transaction + Reliability of Transaction + Research/Charting Options
Learning What Customers Want:Alternative 1 • Direct preference questions: • What brand do you prefer? • What Interest Rate would you like? • What Annual Fee would you like? • What Credit Limit would you like? • Answers too simplistic • (e.g. respondents prefer low fees to high fees, higher credit limits to low credit limits)
Learning What Customers Want:Alternative 2 • Ask about importances “How important is it that you get the best brand, lowest interest rate, lowest annual fee, and highest credit limit that you want?”
Results: Stated Importances • Importance Ratings often have low discrimination
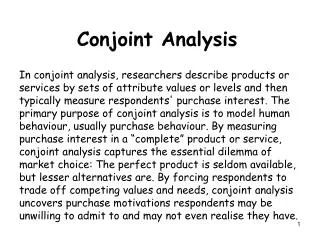
Learning What Customers Want:Alternative 3: Conjoint Analysis • Developed early 1970s • Measures valuation of components of a product/service bundle • Dictionary definition: “Conjoint: Joined together, combined.” • Marketer’s catch-phrase: “Features CONsidered JOINTly”
How Does Conjoint Analysis Work? • Vary product features (IVs) to build many (often >12) product concepts • Ask respondents to rate/rank those concepts (DV) • Determine unique value (utility) each features adds • Interactions and tradeoffs identified
What’s Good about Conjoint? • Realistic questions:Would you prefer . . .210 Horsepower or 140 Horsepower17 MPG 28 MPG • Choose left: prefer Power. Choose right: prefer Economy • Present realistic tradeoff scenarios and infer preferences from product choices • Helps ID key features and boundaries (high and low)
Conjoint Steps: 1. Create Attribute List • Attributes assumed to be independent (Sonites: Weight, Design, Volume, Max Freq, Power, and Price) • Each attribute has varying degrees, or “levels” • Levels assumed to be mutually exclusive of the others (a product has one and only one level level of that attribute) • Can “build in” real world constraints, e.g., weight and power
How to Formulate Attribute Levels • Concrete/unambiguous meaning • “Very expensive” vs. “Costs $575” • “Weight: 5 to 7 kilos” vs. “Weight 6 kilos” • Sonites: • Weight: 10 -20 kg • Design (Index): 3 – 10 • Volume (dm3): 20 - 100 • Max Freq (1000Hz): 5 – 50 • Power (W): 5 - 100 • DO NOT leave meaning up to individual interpretation
Conjoint Output • Utilities (part worths) • Importances
Conjoint Output: Utilities (Part Worths) • Numeric values that reflect how desirable different features are:Feature UtilityVanilla 2.5Chocolate 1.825¢ 5.335¢ 3.250¢ 1.4 • The higher the utility, the better
Conjoint Output :Attribute Importances • Measure how much influence each attribute has on choices • Best minus worst level of each attribute, percentaged:FLAVOR: • Vanilla - Chocolate (2.5 - 1.8) = 0.7 15.2%25¢ - 50¢ (5.3 - 1.4) = 3.9 84.8% ----- -------- Totals: 4.6 100.0% This buyer/group price sensitive • NOTE: Importances directly affected by range of levels chosen for each attribute
1 3 1 2 3 2 1 Note: Weight & Volume excluded For four (4) different “levels” of the top four (4) attributes, what are the utilities?
NOTE: Inverse “U” relationship of attribute levels and utility
Summary • Conjoint is one of several tools made available to aid in setting attribute values. • Please note: This is not an exact science! Consumer preference may shift based on market and competitive dynamics.


![Preference Elicitation [Conjoint Analysis]](https://cdn2.slideserve.com/5322185/preference-elicitation-conjoint-analysis-dt.jpg)