Download

1 / 48
480 likes | 643 Views
Geo-spatial Electrification Planning for Myanmar. Sustainable Engineering Lab Director: Vijay Modi Department of Mechanical Engineering (SEAS) and Earth Institute, Columbia University Nay Pyi Taw, Myanmar, November 22, 2013. Outline. Rationale

E N D
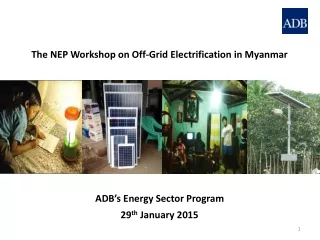
Geo-spatial Electrification Planning for Myanmar Sustainable Engineering Lab Director: Vijay Modi Department of Mechanical Engineering (SEAS) and Earth Institute, Columbia University Nay Pyi Taw, Myanmar, November 22, 2013
Outline • Rationale • Our Approach: analysis platform for decision making: where what technology, prioritization, near-term decisions guided by long-term, least-cost • Not engineering designs, but rapid planning • Examples: village, region and national scales • Combine International Experience + Local Expertise • Our Project Plan and Starting Work in Myanmar
Rationale • Organize information in a systematic digital form • Useful for • Quickly budgeting • Responding to internal and donor needs • Transmission upgrades/generation • Communication bet township/state/national • Co-ordination between grid and off-grid projects
Benefits of National Geospatial Planning • Accelerate national access at scale: • access and service standards can be applied consistently • important for remote, under-served populations • Improve allocation of investments: • ensure on-grid generation benefits from economies of scale • efficient targeting of off-grid systems for smaller communities • enable rapid design and bulk procurement in roll-out • Provide a coordinated investment framework: • help donors & government prioritize according to local development goals • reduce risk for private sector investors and entrepreneurs • NOTE: The difference between design vs. planning
Approach (1) • Acquire detailed geo-spatial, cost and technical information: • Demand points (settlements) • Electricity Infrastructure (MV distribution lines) • Demand level • Growth rates (population, economic) • Cost Factors (grid and off-grid, initial & recurring) (with off-grid)
Approach (2) • Project demand and cost for a defined time-horizon: • Apply growth rates, wealth / income mapping • Algorithmic computation of least-cost electricity system: • Grid extension • Mini- or Micro-grids (renewable, hybrid) • Household Systems (solar) • Generate phased Roll-Out plan for grid and distributed systems (with off-grid)
NetworkPlannerHow it Works • A free, web-based tool(no license fees) Designed by our lab at the Earth Institute • Accepts essential local inputs of geospatial demand points, costs for electricity technologies, growth rates and other key parameters. • Algorithmically plans least-cost electricity systems in these steps: • Computes the lifetime costs (initial and recurring) for meeting projected electricity demand at every point for all electricity options • Chooses the lowest-cost electricity technology for each point • Creates detailed map outputs for the least-cost grid and all standalone systems. • Creates detailed tabular outputs describing investment needs, recurring costs, additional generation required, and many other planning outputs.
Kenya – The First Major Use of Geospatial Planning Kenya / EI Electricity Planning Project: • Results highlighted the need to electrify western, under-served areas • Region specific generation req. and transmission upgrades • Ultimately led to major loan 1.3B from World Bank
Example: Electrification Planning at the Regional scale Flores, Indonesia: 6,300 settlements in Eastern Indonesia
Inputs that went into access planning • Location of each settlements • Population of each settlement • Where is the existing medium-voltage network? • Unit costs of utility infrastructure, off-grid • New customer demand
Essential Local Contribution: Technical and Cost Parameters
Example of Grid-Rollout over 20 Years(Flores Island, Eastern Indonesia)
A complete electricity plan specifies locations with grid access, mini-grids, and off-grid (solar home systems)
Proposed Grid: 166,000 HHsVillage Solar Mini-Grid: 84,000 HHs Model results provide quantitative outputs for locations served by all system types, with capacities and costs.
Solar Mini-Grid: Metrics Solar Mini-Grid: Costs 10% of the kWh from diesel backup for solar mini-grids brings reliability from 80% to 90%
Solar Home Systems: Metrics and Costs Solar Home Systems Solar: Costs
Background Population Modeling GIS Platform Model Results Solar MicroGrids Talking Points Marginal costs of grid connections can increase with roll-out Mini-grid
Mini-Grid Rollout: An example prioritizing higher demand villages
Mini-grid Solar home System Grid? Planning at Township Level High Voltage
Solar Mini Grid Algorithm Results Technology Options
Grid Rollout: An example prioritizing most cost-effective branches Investment in MV line per connection (meters shown) Phase 1 < 20 Phase 2 20 – 25 Phase 3 > 25
Incremental Infrastructure • one could start local and where/when demand grows and grid comes closer connect to the grid • Keeps initial investments small and modular • Does not strain utility immediately • Allows demand grows and entrepreneurship to emerge organically
Our Project Plan • The Earth Institute’s approach to Electrification Planning in Myanmar will include three phases with an in-country workshop roughly marking each phase, as outlined below.
Our Project Plan 1. Data Gathering • Milestone 1: Inception Workshop • Deliverable 1: Inception Report • Milestone 2: Formation of a GIS dataset with acceptable resolution of population and MV network representation • Deliverable 2: Interim Report
Our Project Plan 2. Demand Analysis & Quantify Supply Needed • Milestone 3: Workshop on Initial Results • Deliverable 3: Draft Final Geospatial Rollout Plan 3. Final Scaled-Analysis and Knowledge Transfer • Milestone 4: Final Results Workshop • Milestone 5: GOM feedback on Draft Report • Deliverable 4: Final Geospatial Rollout Plan & accompanying datasets developed
Starting Work For Myanmar: Data Sets Needed for Electricity Modeling • Settlement Data from Village or Village Tracts • Locations • Populations • Existing Grid Distribution Data • map or digital file for medium-voltage lines • Other drivers • Supply options, current/future • Demand/hh, population and demand growth, • unit costs of options
Village locations within Village Tracts Electrification Planning benefits from village level data. Village Tract data may be supplemented in some cases
Settlement Data • From MOLFRD, DRD • Village location and population, 2001 • In absence of more recent data, an excellent starting point • Project to future • Can we updated as new figures become available
Existing distribution grid • Transmission Lines • Available through MEPE, up to 66 kV • Medium Voltage lines, ESE, YESB • 33 kV and 11 kV lines • Currently not available in digital geo-spatial form • ESE is compiling paper/scan images from all states/regions, estimated avai: 1 month • Smaller off-grid systems • Expect to report later
Other drivers • Large generation Sources • Hydropower, HGPE (generation), DHP (planning) • Cost of Grid Generation in the future • Some uncertainty due to variable international fuel supply, scale of demand growth • JICA study • Hydro potentials, thru MOPE • Hydro <5MW, from ESE • Unit costs, demand
Original:jpeg with hand-drawn MV lines (red) GIS product:shapefile with digitized MV lines (blue)
Training and Capacity Building : Example: Data collection with smartphones Training and detailed work with local electricity technicians and managers resulted in completion of a detailed local medium-voltage distribution grid map for a region in Eastern Indonesia Training & mapping of MV grid lines (IDN) Training & mapping of MV grid lines (IDN) West Timor (IDN) MV grid initial estimate West Timor (IDN), MV grid lines following EI training & mapping
Approach to data • Settlement Data valuable for electricity, gas, roads, water, and other services • Tools to gather and “maintain” data. • How to rapidly capture planning grade data for existing lines • Work closely with Government/Utility to embed tools/processes in their systems
Working with Ministries, Utilities, Enterprises • We would like to begin here in Nay Pyi Taw, possibly following up in other regions or offices. We ask your permission and support • Our plan and approach is to work side-by-side with local experts and practitioners to ensure the relevance, completeness and accuracy of all data and outputs. • Workshop tomorrow