Download
1 / 28
280 likes | 284 Views
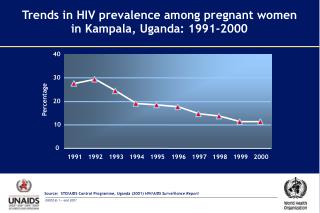
Modelling changes in HIV prevalence among women attending antenatal clinics in Uganda Brian Williams. b. N. d. I. l. S. /. N. I. S. I. m. I. m. S. = birth rate N = S + I = rate at which new infections occur = mortality. The basic model. R 0 = 3.3. b. N. d. I.

E N D
Modelling changes in HIV prevalence among women attending antenatal clinics in Uganda Brian Williams
b N d I l S / N I S I m I m S =birth rate N=S +I = rate at which new infections occur = mortality The basic model
b N d I l S / N I S I I m S Normal (Weibull 2) = birth rate N=S +I = infection rate I= Weibull mortality Exponential (Weibull 1)
~ I b d N l S / N I I S m I m S = birth rate N = population = e–P I = Weibull mort. e –P ~ Heterogeneity in sexual behaviour
b d N I l I S / N I S I m S = birth rate N = population • = C(t) I= mortality ~ ~ ~ ~ C(t) Including control
b d N I l I S / N I S I m S ~ * –aM = birth rate N = population • = e I= mortality e ~ –aM * Mortality leads to behaviour change
Nairobi 6 yr Nunn P et al. Tuberculosis control in the era of HIV. Nat Rev Immunol. 2005 Oct;5(10):819-26.
TB incidence among gold miners in SA Corbett EL Stable incidence rates of tuberculosis (TB) among human immunodeficiency virus (HIV)-negative South African gold miners during a decade of epidemic HIV-associated TB. J Infect Dis. 2003;188: 1156-63.
SS+ Tuberculosis Prevalence Incidence Disease Duration (%) (%/yr) (yr) HIV+ 0.44 (0.02-1.05) 2.87 (1.94-4.25) 0.15 (0.05-0.48) HIV- 0.55 (0.14–0.95) 0.48 (0.27-0.84) 1.15 (0.48-1.13) DDR = 0.13 (0.09–0.20) Gold miners in South Africa We define disease duration as prevalence divided by incidence
TB-HIV model Repeat the model 4 times, once for each stage of HIV. Use time series of HIV prevalence to determine incidence. Incidence gives rate at which people enter first stage; overall (Weibull) survival determines rate at which people move to next stage. Williams BG et al.The impact of HIV/AIDS on the control of tuberculosis in India. PNAS 2005 102: 9619-9624.
Impact of interventions on TB cases in Kenya Baseline ARV 80% TLTI (6 m) TLTI (life) ARV 100% TB detect. TB cure HIV incid . 800 600 400 200 0 TB incidence/100k/yr Base line: CDR = 50% CR = 70% Interventions: 1% increase 1980 2000 2020 2040 Year Currie, C. et al. Cost, affordability and cost-effectiveness of strategies to control tuberculosis in countries with high HIV prevalence. BMC, 2005. 5: 130.
Percent Percent HIV positive HIV negative Williams BG et al. HIV Infection, Antiretroviral Therapy, and CD4+ Cell Count Distributions in African Populations. J Infect Dis, 2006 194: 1450-8.
2,000 Initial CD4/mL 1,000 20 10 Time to death (yrs) 2,000 Initial CD4/mL 1,000 20 10 Time to death (yrs) Model 1 CD4 decline independent of starting value Survival determined by pre-infection CD4 Model 2 Survival independent of starting value CD4 decline determine entirely by starting value and survival distribution
Spatial Epidemiology of HIV Doubling time = 1 year Life expectancy = 10 years Number of partners = 4 Proportion of random partners chosen at random = 0 (left hand set) or 10% (right hand set) in the following slides. Note that in this model migrants have exactly the same sexual behaviour and individual risk as non-migrants.
Questions for all of us • Can we combine spatial/network models with our more conventional continuous time models of HIV? • Can we get a better understanding of the host-viral interaction? • What are the population level implications of 2? • Do we have enough data to explore fully the joint dynamics of TB and HIV?
Advice to young epidemiologists Never make a calculation until you know the answer. Make an estimate before every calculation, try a simple biological argument (R0, generation time, selection, survival, control). Guess the answer to every puzzle. Courage: no one else needs to know what the guess is. Therefore, make it quickly, by instinct. A right guess reinforces this instinct. A wrong guess brings the refreshment of surprise. In either case, life as an epidemiologist, however long, is more fun. Plagiarised from E.F. Taylor and J.A. Wheeler Space-time Physics 1963