Download
1 / 46
460 likes | 620 Views
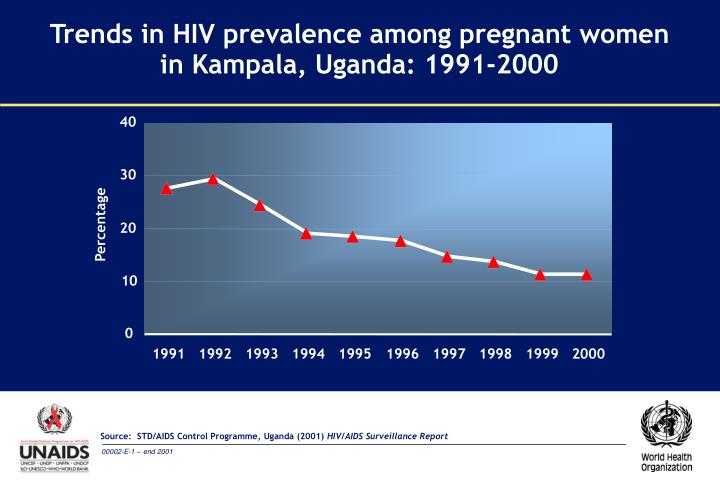
Trends in HIV prevalence among pregnant women in Kampala, Uganda: 1991-2000. 40. 30. Percentage. 20. 10. 0. 1991. 1992. 1993. 1994. 1995. 1996. 1997. 1998. 1999. 2000. Source: STD/AIDS Control Programme, Uganda (2001) HIV/AIDS Surveillance Report.

E N D
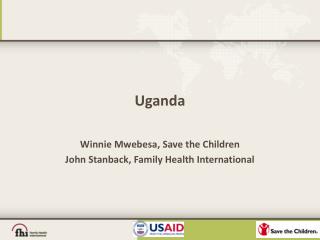
Trends in HIV prevalence among pregnant women in Kampala, Uganda: 1991-2000 40 30 Percentage 20 10 0 1991 1992 1993 1994 1995 1996 1997 1998 1999 2000 Source: STD/AIDS Control Programme, Uganda (2001) HIV/AIDS Surveillance Report
HIV prevalence rates among pregnant women attending antenatal clinics in urban sites in Cameroon: 1989-2000 20 18 Bamenda 16 Limbe 14 % HIV-positive Yaounde 12 Garoua 10 8 6 4 2 0 1989 1990 1991 1992 1993 1994 1995 1996 1997 1998 1999 2000 Source: National AIDS Programme, Cameroon (1989-2000). Data compiled by the US Census Bureau
Condom use among men with non-regular partners in selected sub-Saharan African countries: 1994-2000 70 Malawi United Rep. of Tanzania 60 Uganda Zambia 50 40 % 30 20 10 0 1994 1995 1996 1997 1998 1999 2000 Source: Macro International (1994-2000) Demographic and Health Surveys; Measure Evaluation
HIV prevalence among sex workers in selected provinces in China: 1993-2000 12 Guangxi Guangzhou Yunnan 9 % HIV-positive 6 3 0 1993 1994 1995 1996 1997 1998 1999 2000 Source: National AIDS Programme, China (1993-2000). Data compiled by the US Census Bureau
1,800 1,500 1,200 900 600 300 0 Cumulative reported HIV infections per million population in Eastern European countries: 1993-2001 Estonia* Russian Federation Cases per million population Ukraine Latvia Belarus Moldova, Republic of Kazakhstan Lithuania 1993 1994 1995 1996 1997 1998 1999 2000 2001 Projected * actual 2001 year-end data Source: National AIDS Programmes (2001) HIV/AIDS surveillance in Europe. Mid-year report. Data compiled by the European Centre for the Epidemiological Monitoring of AIDS
HIV prevalence among pregnant women in Santo Domingo, the Dominican Republic: 1991-2000 2.5 2.0 1.5 % HIV prevalence 1.0 0.5 0.0 1991 1992 1993 1994 1995 1996 1997 1998 1999 2000 Source: National AIDS Programme, the Dominican Republic, 1991-2000
HIV incidence among men who have sex with men in Vancouver, Madrid and San Francisco: 1995–2000 4 3 Annual HIV incidence (%) 2 1 0 1995-99 2000 1996 2000 1996 1999 Vancouver Madrid San Francisco Sources: (Vancouver) Hogg RS et al. (2001) AIDS. (Madrid) Del Romero J et al. (2001) AIDS. (San Francisco) Katz MH et al. (2002) Am. J. of Public Health
Changes in life expectancy in selected African countries with high and low HIV prevalence: 1950-2005 65 60 with high HIV prevalence: Zimbabwe 55 South Africa Botswana 50 Life expectancy (years) 45 with low HIV prevalence: 40 Madagascar Senegal 35 Mali 30 1950– 1955 1955- 1960 1960- 1965 1965- 1970 1970- 1975 1975- 1980 1980- 1985 1985- 1990 1990- 1995 2000- 2005 1995- 2000 Source: UN Department of Economic and Social Affairs (2001) World Population Prospects, the 2000 Revision
Reduction in life expectancy compared to the 'no AIDS' scenario in selected countries: 2000-2005 Botswana Zimbabwe Swaziland South Africa Kenya Mozambique Côte d'Ivoire Cameroon Burkina Faso Haiti Guyana Bahamas Cambodia Dominican Rep. Angola Myanmar Thailand 0 5 10 15 20 25 30 35 40 Number of years Source: UN Department of Economic and Social Affairs (2002) World Population Prospects, the 2000 Revision
Estimated and projected deaths at ages 15-34, with and without AIDS in South Africa: 1980-2025 2,000 Without AIDS With AIDS 1,600 1,200 Deaths (thousands) 800 400 0 1995-2000 1980-1985 2010-2015 1985-1990 2015-2020 2000-2005 1990-1995 2005-2010 2020-2025 Source: UN Department of Economic and Social Affairs (2002) World Population Prospects, the 2000 Revision
Projected reduction in size of primary-school-age population by 2010, in selected African countries 30 25 20 % reduction 15 10 5 0 Zimbabwe Zambia Kenya Uganda Source: World Bank, 2000
Percentage of workforce lost to AIDS by 2005 and 2020 in selected African countries 50 2005 2020 40 30 % 20 10 0 Botswana Côte d’Ivoire Togo Mozambique Ethiopia Cameroon Nigeria UR Tanzania CAR Zimbabwe Guinea-Bissau South Africa Sources: ILO (2000) POPILO population and labour force projection; UN Department of Economic and Social Affairs, Population Division (1998) World Population Prospects: the 1998 Revision
The impact of HIV/AIDS on industries: an overview Loss Increased Increased Loss Declining of tacit absenteeism staff turnover of skills morale knowledge Insurance cover Increasing demands Retirement funds HIV/AIDS in for training and the country recruitment Health and safety Reduced Declining Declining markets, foreign intellectual labour pool, Medical assistance direct capital suppliers investment Funeral costs Declining Declining re - investment reliability Declining Increased costs productivity Declining profits Source: UNAIDS (2000) Adapted from The Business Response to HIV/AIDS: impact and lessons learned
Proportion of young women who have heard of AIDS and have at least one negative attitude towards people living with AIDS Azerbaijan Note: Respondents were asked two hypothetical questions about men and women with HIV: (1) A teacher who looks healthy but is HIV- positive should be allowed to continue working and (2) Would they buy something from an HIV-positive shopkeeper. Tajikistan Gambia Moldova Albania Bosnia & Herzegovina Yugoslavia (FR) Comoros Guinea Bissau Sierra Leone Chad Cote d'Ivoire DominicanRepublic Vietnam Somalia Philippines Ukraine Niger 0% 20% 40% 60% 80% 100% Source: UNICEF (1999-2001) Multi-Indicator Cluster Surveys
Percentage of young men and women (15-19) who had sex before their 15th birthday: 1998-2001 Kazakhstan Boys Zimbabwe Girls Haiti Poland Latvia Hungary Gabon Malawi Kenya UR Tanzania Mozambique USA Finland Guinea Cameroon Togo Niger Nigeria Ethiopia 0 10 20 30 40 50 Source: Measure Evaluation (1998-2001); UNICEF
Percentage of sexually experienced girls in South Africa who say … “I have been forced to have sex.” “I am afraid of saying no to sex.” Agree 33% Yes 39% No 61% Disagree 60% 7% Disagree 39% Agree 55% 6% “There are times I don't want to have sex but I do because my boyfriend Insists on having sex.” Source: Kaiser Family Foundation/KLA (2000) South African National Youth Survey
Note: Insufficient data on men who did not finish primary level of education in Uganda, Zimbabwe and Dominican Republic. Percentage of men who used a condom with a recent non-regular partner, by level of formal education: 1995-2000 100 None Primary 80 Secondary or more 60 % 40 20 0 UR Tanzania Mali Togo Niger Chad Dominican Republic Brazil Benin Kenya Malawi Uganda Zambia CAR Zimbabwe Cameroon Source: Macro International (1995-2000) Demographic and Health Surveys; UNICEF
2015 1985 1990 1995 2000 2005 2010 2020 Scenario of the epidemic in Thailand, had there been no intervention through 2020, and observed epidemic curve 10,000 No Intervention Observed 8,000 6,000 Number of HIV infections (thousands) 4,000 2,000 0 Source: Division of AIDS, Ministry of Public Health in Thailand; Thai Working Group on HIV/AIDS Projection (2001) HIV/AIDS Projections for Thailand: 2000-2020
HIV prevalence among injecting drug users in Kathmandu, Nepal: 1991-1999 60 50 40 30 % HIV-positive 20 10 0 1991 1992 1993 1994 1995 1996 1997 1998 1999 Sources: Peak A et al. (1995); AIDS. Gurubacharya RL et al. (1998); 12th World AIDS Conference, Abstract 23246. Oelrichs RB et al. (2000) J. Virol.
HIV prevalence rates among sex workers and injecting drug users in selected sites, Indonesia: 2000-2001 SW 6.4% SW 8.0% SW 6.0% IDUs 40% SW 1.5% SW 26.5% IDUs 53% IDUs 24.5% HIV prevalence rates 1 - 5 % 0 % < 1% > 5 % SW - Sex Workers IDUs – Injecting Drug Users Source: Indonesian National AIDS Commission (2001) HIV/AIDS and other sexually transmitted infections in Indonesia: challenges and opportunities for action
Increase in reported condom use with non-regular partners in selected districts in Uganda: 1996-2000 80 60 % condom use 40 20 0 1997 1999 1996 1999 1997 2000 1997 2000 Mbara Mpigi Masindi Pallisa Source: STD/AIDS Control Programme, Uganda (2001) HIV/AIDS Surveillance Report
Condom procurement gap in sub-Saharan African countries in 1999 Six countries with highest condom procurement rate 30 25 20 Average condom procurement of top 6 countries = 16.9 15 Condoms per man per year 10 Additional condoms needed to get all 5 countries to the level of 16.9 = 1.9 billion per year 0 1 3 5 7 9 11 13 15 17 19 21 23 25 27 29 31 33 35 37 39 41 43 45 47 Countries in sub-Saharan Africa, ordered by condom procurement rate Source: Shelton JD, Johnston B (2001) Condom gap in Africa: evidence from donor agencies and key informants, British Medical Journal
Costa Rica 11995 Mexico (8 studies) 1988-97 Uruguay 1997 Malaysia 1988-97 Japan 1986-97 Pakistan 1997 India 1994-98 Bangladesh 1998 Cambodia 2000 Egypt 11999 Poland 1996 Slovenia 1997 Latvia 1998 Sao Paulo, Brazil 1997 HIV prevalence among men who have sex with men, in selected countries: 1986-2000 35 30 25 20 % HIV positive 15 10 5 0 North Africa & Middle East Latin America Asia Eastern Europe Sources: Country data compiled by U.S. Census Bureau (1996-2000); Cambodia data reported in: Monitoring the AIDS Pandemic (MAP): the status and trends of HIV/AIDS/STI epidemics in Asia and Pacific (2001)
Knowledge and behaviour among sex workers and their clients in Jakarta, Surabaya and Manado, Indonesia: 1996-2000 90 80 70 60 Know that consistent condom use prevents HIV - sex workers 50 Percent Know that consistent condom use prevents HIV - clients 40 Always use a condom in commercial sex - sex workers 30 Always use a condom in commercial sex - clients 20 10 0 1996 1997 1998 1999 2000 Source: FHI (2001) What drives HIV in Asia? A Summary of Trends in Sexual and Drug-Taking Behaviours
HIV prevalence and reported consistent condom use among female sex workers, Abidjan,Côte d'Ivoire: 1992-1998 100 100 HIV prevalence Reported consistent condom use 80 80 60 60 % consistent condom use % HIV- positive 40 40 20 20 0 0 1992 1993 1994 1995 1996 1997 1998 Source: Ghys PD et al. (2002) AIDS
Probable uptake: 260 million Probable uptake: 49 million Estimated need for, and probable uptake of HIV/AIDS vaccine High-efficacy vaccine Low/moderate-efficacy vaccine Total estimated need: 690 million Total estimated need: 260 million Source: UNAIDS/WHO, 2002
Probable uptake: 260 million Probable uptake: 49 million Estimated need for, and probable uptake of HIV/AIDS vaccine High-efficacy vaccine Low/moderate-efficacy vaccine Total estimated need: 690 million Total estimated need: 260 million Source: UNAIDS/WHO, 2002
Voluntary counselling and testing as an entry point for HIV prevention and care Acceptance of and coping with serostatus Planning for th e future (care of orphans and family, making will etc.) Promotes facilitates behaviour change (sexual, safe injecting) Prevention of mother-to-child transmission and maternity services Normalization and destigmatization of HIV/AIDS VCT Peer, social and community support, including PLHA support groups STI prevention, screening and treatment Access to early medical care for opportunistic infections, preventive therapy for TB, including ARVs Access to family planning and condoms (male and female) Source: UNAIDS (2002)
Percent of women aged 15-49* who know where to get a HIV test and have been tested: 1998-2000 90 Know a place to get tested 80 Have been tested 70 60 50 % 40 30 20 10 0 Niger Senegal Ukraine Surinam Mongolia Vietnam Comoros Republic Dominican Azerbaijan Cote d'Ivoire Sierra Leone * except for the Dominican Republic, where female aged 12-49 were tested Source: UNICEF (2000) Multi-Indicator Cluster Survey 2
Roles, training and responsibilities of VCT counsellors Level of Counsellor Roles and responsibilities •Senior counsellor •Experienced counsellor with advanced counselling training •Support and supervision of other counsellors •Mentoring role •Training of other cadres of counsellors •Accept referrals of difficult or complex cases •Facilitating/supervising support clubs (on an occasional basis) •Professional counsellor •Counsellor with a professional back ground (e.g. nursing, teacher etc.) with pre- and post test and ongoing counselling training •Pre- test and post-test counselling •Couple counselling •Follow up counselling •Support for lay and peer counsellors •Pre- test and post-test counselling of routine case •Follow- up and supportive counselling for uncomplicated cases. •Lay counsellor •Counsellor with pre- and post- test and ongoing counselling training •Advocacy and community mobilisation •HIV education and preventive counselling •Follow- up and supportive counselling for uncomplicated cases. •Running/supporting support clubs •Peer counsellor •Counsellor who comes from the same background as clients (may include PLHAs). For example women who have been through PMTCT projects, peer workplace counsellors, youth peer counsellors Source: UNAIDS (2001) Report from WHO/UNAIDS Technical Consultation on Voluntary HIV Counselling and Testing
Percentage of children aged 10-14 who are still in school, according to whether their parents are alive:selected countries, 1997-2001 96 84 91 85 70 91 90 82 45 81 67 43 31 50 52 85 37 65 70 65 94 54 45 77 68 61 34 24 Both parents alive, living with at least one parent (%) Both parents dead (%) Source: UNICEF (1997-2001) Multi-Indicator Cluster Surveys; Macro International (1997-2001) Demographic and Health Surveys
HIV/AIDS deaths in 2001 and number of people using antiretroviral drugs by end 2001: by region 2,500 HIV/AIDS deaths People using ARV drugs Thousands 2,000 1,500 1,000 500 0 sub-Saharan Africa Asia (excluding Central Asia) Latin America & Caribbean High -income Countries (excluding Japan) Eastern Europe & Central Asia North Africa & Middle East Source: UNAIDS/WHO, 2002
Cost of antiretroviral drug purchases, avoided expenditures and final costs to the Ministry of Health Brazil, 1997 - 2001* 400 ARV purchases Avoided expenditures Final costs 350 300 250 200 US$ million 150 100 50 0 -50 1997 1998 1999 2000 2001 * Estimated data Source: Ministry of Health Brazil, 2001
Prices (US$/year) of a first-line antiretroviral regimen in Uganda: 1998-2001 14,000 Launch of Accelerating Access Initiative 12,000 Negotiations with R & D Pharma within the AAI 10,000 Cipla offer of price reductions to Uganda 8,000 Price US$ Further price reductions by Bristol-Myers Squibb and Merck 6,000 4,000 Further discussion with Cipla 2,000 0 Jan Feb Mar Apr May Jun Jul Aug Jun Jul Aug Apr Nov Dec Oct 2000 2001 1998 Source: WHO/UNAIDS, 2002
Projected annual expenditure requirements for HIV/AIDS care and support by 2005, by region South and Southeast Asia: US$670M (15.09%) East Asia, Pacific: US$80M (1.80%) Latin America, Caribbean: US$550M (12.39%) Eastern Europe, Central Asia: US$20M (0.45%) North Africa, Middle East: US$50M (1.13%) Sub-Saharan Africa: US$3,070M (69.14%) Total: US$4,440 million Source: Schwartlander B et al (2001) Resource needs for HIV/AIDS, Science
The HIV/AIDS continuum of care Primary health care Health posts Dispensaries Traditional healers Orphan care Secondary health care District hospitals HIV clinics Social/legal support Hospices Community care NGOs Churches Youth groups Volunteers Voluntary counselling and testing Specialists and specialized care facilities PLWHA Palliative emotional and spiritual support Self-Care The entry point Peer support Tertiary health care Home care Source: WHO/UNAIDS (2000) Key Elements in HIV/AIDS Care and Support. Draft working document
Public, private and donor funding for HIV/AIDS, in selected Latin-American and Caribbean countries*: 2000 External sources 1% Private funds 35% Public funds 64% * Argentina, Bolivia, Brazil, Chile, Costa Rica, Mexico, Peru, and Uruguay Source: FUNSALUD, SIDALAC, UNAIDS, 2001
Projected available resources and resource needs in low- and middle-income countries: 2003-2005 10,000 International 8,000 National 6,000 Private US$ millions 4,000 Global Fund to Fight AIDS, Tuberculosis and Malaria 2,000 Unmet need 0 2003 2004 2005 Source: Adapted from joint WHO/UNAIDS presentation, 27 January 2002, Geneva
Public expenditure on health as percentage of general government expenditure in African countries: 1998 18 15 Abuja Target = 15% 12 9 % expenditure on health 6 3 0 CAR Guinea-Bissau* Libya Equatorial Guinea Djibouti South Africa Mauritius Sierra Leone* Angola Liberia Algeria Cote d'Ivoire Eritrea Burundi * Heavily indebted, poor countries Botswana Nigeria Tunisia Somalia Gabon Senegal* Mauritania* Cameroon* Guinea* Ethiopia* Benin* Lesotho Sudan Seychelles Swaziland Sao Tome & Principe* Niger* Madagascar* Congo Namibia Egypt Burkina Faso Zimbabwe Morocco Togo DR Congo* Zambia* Gambia Comoros Mozambique* Cape Verde Chad* Kenya* Mali* Ghana* Malawi* Uganda* UR Tanzania Rwanda* Source: WHO (2001) World Health Report
Documented available international resources for HIV/AIDS: 2002 United States of America 30% United Nations system organizations 27% Other donor countries* 13% United Kingdom 14% *Members of the Development Assistance Committee of the OECD United Kingdom Canada, France, Germany, Italy, Japan 9% Foundations 7% OECD Source: UNAIDS, 2002
Identified available resources for the Global Fund to Fight AIDS, Tuberculosis and Malaria, by source, as of April 2002 350 300 250 200 US$ millions 150 100 50 0 US Other donor countries* Italy France, UK, Canada, Germany Japan Foundations/ corporate sector • Other member countries of the Development Assistance Committee of the Organisation • for Economic Cooperation and Development and the European Union Source: Joint WHO/UNAIDS presentation, 27 January 2002, Geneva
How effective are poverty-reduction strategy papers (PRSPs) in tackling AIDS? 70 Strong Average Weak Nil 60 50 40 % of PRSPs 30 20 10 0 Anti-poverty analysis AIDS strategies Medium-term goals Short-term goals Note:Based on 5 full and 20 interim poverty-reduction strategy papers from Africa, as of November 2001 Source: Hecht R et al. (2002) Making AIDS Part of the Global Development Agenda, Finance and Development
Net Official Development Assistance (ODA) as percentage of gross domestic product (GDP): 2000 Denmark Netherlands Sweden Norway Luxembourg Switzerland Belgium UN target 0.70% France United Kingdom Finland Japan Germany Portugal Australia Canada Ireland Austria New Zealand Spain Greece Italy United States 0.00 0.10 0.20 0.30 0.40 0.50 0.60 0.70 0.80 0.90 1.00 1.10 %, ODA/GDP Source: For GDP data, OECD, National Accounts of OECD Countries, Volume 1, for ODA data, OECD
Worldwide assessment of HIV/AIDS programme preparedness (114 countries) 114 95 76 57 Number of countries 38 19 0 National Strategic Plan Implement- ation Plan Costed Plan Monitoring & Evaluation Plan Coordination Mechanism Source: Joint WHO/UNAIDS presentation, 27 January 2002, Geneva
Updated version Cumulative reported HIV infections per million population in Eastern European countries: 1993 - 2001 1,500 Estonia Russian Federation 1,200 900 Ukraine Cases per million population Latvia 600 Belarus Moldova, Republic of 300 Kazakhstan* Lithuania Georgia 0 Uzbekistan 1993 1994 1995 1996 1997 1998 1999 2000 2001 * based on 2001 mid-year data Source: European Centre for the Epidemiological Monitoring of AIDS. HIV/AIDS surveillance in Europe. End-of-year report 2001. Saint-Maurice: Institut de Veille Sanitaire, 2001. No. 66
Updated version Net Official Development Assistance (ODA) as percentage of gross domestic product (GDP): 2001 Denmark Netherlands Norway Sweden Luxembourg Belgium UN target 0.70% Switzerland France United Kingdom Finland Spain Ireland Germany Portugal Austria Japan Australia Canada New Zealand Greece Italy United States 1.10 0.00 0.10 0.20 0.30 0.40 0.50 0.60 0.70 0.80 0.90 1.00 %, ODA/GDP Source: For GDP data, OECD, National Accounts of OECD Countries, for ODA data, OECD