Download
1 / 30
300 likes | 452 Views
HIV prevalence decline in Uganda ABC….DE….F....?. Evidence from Rakai, Uganda. Ugandan national response. Government of Uganda, Ugandan NGOs, community groups Open and VERY proactive in discussing HIV

E N D
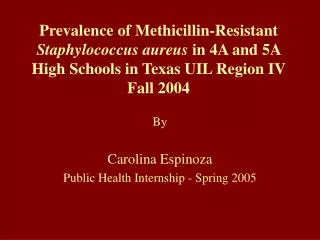
HIV prevalence decline in UgandaABC….DE….F....? Evidence from Rakai, Uganda
Ugandan national response • Government of Uganda, Ugandan NGOs, community groups • Open and VERY proactive in discussing HIV • Multiple programs: Health ed, promotion of ABC, VCT programs, condom social marketing, other
Uganda: Median HIV prevalence, pregnant women Kampala Other sites Source: HIV/AIDS Surveillance Report, MOH, June 2001
Which factors affect HIV prevalence in Uganda? • Behavior change? (ABC) • Abstinence • “Befaithful” • Condoms • Relative contribution of each? • Maturation of the epidemic? (DE..) • Mortality rates (Deaths) • Epidemiology of HIV transmission: • Population distribution of HIV viral load
Rakai Community Cohort Study (RCCS) • Data on 44 communities under continuous annual surveillance 1994-2003 • Door-to-door surveys: questionnaire, blood & urine samples • Annual compliance ~ 85-90% • Annual sample: ~10,000 adults 15-49
HIV prevalence % (age standardized), males and females 15-49, by 1994/5-2003 19.7% Women: 34% reduction * 12.9% * 15.0% 9.3% Men: 38% reduction * N = 8966 8328 8981 8259 (1812) 10,380 11,160 12,609 9,700 - Survey round
Rakai% of men 15-49 with 1 or 2+ partners in past year, by survey round, 1994-2003 2+ 50% 1 N = 4350 4386 4828 4791 4321 5659 5852 6630 4314 Proportion with 2+ partners: X 2 for trend = 426.8, p < 0.0001
Rakai: % of men 15-49 with 1 or 2+ NON-MARITAL partners in past year, 1994-2003 50% 2+ 1 Survey round N = 4350 4386 4828 4791 4321 5659 5852 6630 4315 Survey round Proportions with 1 or more non-marital increased: p < 0.0001
Rakai: % of men and women aged 15-49 reporting condom use with most recent non-marital partner, 1994-2003 Men consistent Women consistent Men inconsistent Women inconsistent
Female reported condom use and marital status Inconsistent condom use Consistent condom use Condom use, particularly consistent use, in much higher in non-marital.
Rakai: Condom use and HIV acquisition • Condom use Incidence Rate Ratio (95% CI) • None 1 • Irregular 0.96 (0.53-1.74) • Consistent 0.37 (0.15-0.88) Adjusted for age, gender, marital status, sex partners, non-marital sex S Ahmed et al, AIDS, 2001
Rakai: HIV incidence/100 py, 1994/95-2002/03, men and women 15-49 Survey follow up round Survey follow up round
Rakai: HIV prevalence adolescents 15-19, 1994/95 - 2002/03 Females Both sexes Males
Sexual abstinence in adolescent men and women 15-19 50% Decline in sexual abstinence, esp among male adolescents
Median age first sex males 1995: ~17.1 yrs 2002: ~16.2 yrs P< 0.05 Median age first sex females ~15.9 1995 ~15.5 2002 NS Median age of first sex among adolescents, Rakai 1995 and 2002 Median age at first sex declined, especially among males
Rakai: % of adolescent men 15-19 reporting 1 or 2+ non-marital partners, lifetime. (1994-2003) 50% 2+ 1 N = 1037 995 1068 927 1101 1005 1194 938 Survey round Proportions with 1 or more non-marital: X2 for trend = 61.5, p < 0.0001
Rakai % of adolescent women 15-19 reporting 1 or 2+ non-marital partners, lifetime. (1994-2003) 50% 2+ 1 1 N = 1288 1266 1309 1145 791 1598 1490 1621 985 Survey round Proportions with 1 or more non-marital: X2 for trend = 136.9, p < 0.00001
Rakai: Condom use by adolescents, 1994/95 – 2002/03 Male consistent Male inconsist Female consistent Female inconsistent
Rakai: HIV Incidence/100 PYO among young men and women aged 15-24, 1995 – 2002 Women 15-24 Women 15-24 Men 15-24 Men 15-24 95/96 96/97 98/99 99/00 00/01 01/02
ABC in Rakai? • Some evidence that A and B are declining over time • Evidence that Condom use is increasing, esp in non-marital relationships
Rakai: D..E.. • What else contributes to trends in HIV prevalence in Rakai? • We examined the potential roles of: • Death • Viral Epidemiology
Rakai: HIV-related mortality versus incidence • Mortality in HIV+ • 1990/91 = 11.8/100 py • 1997/98 = 13.3/100 py • 2001/02 = 14.0/100 py • 2001/02 – 2002/03 (survey round 8 – 9) • New incident cases = 125 • Deaths of HIV+ = 200 • In/out migration of HIV+ ~ equal. • Death alone accounted for a 0.6 percentage point reduction in HIV prevalence over 1 year. • Observed decline in HIV prevalence 1994/5 to 2002/3 = 6.2% points. - Mortality alone contributed ~5% points to the decline
Rakai: % of men 15-49 reporting 2+ partners past year, by HIV status, 1995/6-2002/3 Recent male seroconverters HIV prevalent males HIV-neg males
HIV transmission per coital act by stage of infection (source Wawer JID 2005) Latent infections AIDS Incident infections Transmission per 1,000 coital acts Months after Months of follow up Months preceding index partner (Latency) death of index seroconversion partner
ABC…DE….F….. • AB:Prevention fatigue? Cohort effects? Need to assess in other Ugandan settings and to counteract potential declines in these behaviors • C:Condoms are essential. Uganda currently has an acute shortage of condoms (manufacturing problems…) • D: Death contributes to HIV prevalence trends. • E (Epi): emerging patterns of core group behaviors/HIV viral load distribution suggest there is a potential risk for increased HIV transmission • F…ARVs…Urgent need to avoid treatment optimism/ behavioral disinhibition. Need to safeguard the Future NOW
Rakai Health Sciences Program Uganda Virus Research Institute Uganda David Serwadda Nelson Sewankambo Fred Wabwire Tom Lutalo Godfrey Kigozi Fred Nalugoda Fred Makumbi Zikulah Namukwaya Johns Hopkins Ron Gray Tom Quinn Xianbin Li Columbia Maria Wawer Support: NIH/NIAID, Walter Reed Army Institute of Research, Gates Foundation, Gates Institute of Pop and Repro Hlth at Johns Hopkins