Download
1 / 54
540 likes | 542 Views
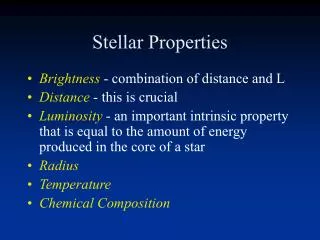
Astronomy 2 Overview of the Universe Winter 2006 6. Lectures on Stellar Properties. Joe Miller.

E N D
Astronomy 2Overview of the UniverseWinter 20066. Lectures on Stellar Properties. Joe Miller
The basic unit of distance is the parsec (pc), which comes from parallax of a second of arc. The light year is the distance light travels in one year moving at 300,000 km/sec. The sun is about eight light minutes away. 1 pc = 3.26 lt. yrs.The closest star other than the sun is Proxima Centauri with d=1.30 pc and p=0.772 arcsec. A star with a distance of 1 pc will have a parallax of 1 arcsecond, that is, its position in the sky will shift one arcsecond over a baseline of 1 astronomical unit (au). This leads to the basic formula for distance:
Measuring the brightness of stars.Astronomers today still use the scheme developed by Hipparchus 20 centuries ago! It is a relative system, not absolute, in that a star’s brightness is compared to the brightness of standard stars.The magnitude system:Hipparchus called the brightest stars in the sky “stars of the first magnitude” and the faintest stars the eye could see “stars of the sixth magnitude.” Thus there were five magnitudes difference between the brightest and faintest stars (6-1). It turns out that a difference of five magnitudes corresponds to a ratio of 100 times in brightness or light output.5 magnitudes difference = factor of 100 in brightness
Magnitudes (cont.)Note that magnitudes work backward- the fainter the star, the bigger the magnitude or number.1 magnitude difference = factor of 2.5.. in brightness2 = 2.5 x 2.5 = 6.25.5 = 2.5 x 2.5 x 2.5 x 2.5 x 2.5 = 100.Faintest stars we can detect with largest telescopes are about magnitude 30! What is brighter than mag. 1? Mag. 0, and brighter than that you go negative:Venus = -4.4, full moon = -12.5, sun = -27.
We have been discussing the apparent magnitude, which is generally written with the lower case m. The apparent magnitude is what you observe.But, m depends on two things: how much light a star is actually putting out, its intrinsic brightness, and how far away it is.In order to study the physical properties of stars, astronomers must know their intrinsic light output. Once again, astronomers have set up a relative system to do this.
Intrinsic brightness of starsIn order to compare the relative amount of light output of different stars, astronomers have defined a special kind of magnitude called the absolute magnitude. It is written with the capital M.M is the apparent magnitude m a star would have if it were 10 pc away. In other words, 10 pc has been chosen as the standard distance at which all stars can be compared in brightness. If a star is at 10 pc, then M=m. If a star is not at 10 pc, then one must calculate the brightness it would have if its distance were changed to 10 pc. This is done using the inverse square law of light.
Inverse square law of light.Brightness falls off as where d is the distance to the observer.
Example of calculating M from d and m.Suppose d=100 pc m= +6Now we ask: how bright would this star be if we moved it to a distance of 10 pc? Brightness B goes asIn other words, bringing a star 10 times closer makes it 100 times brighter. But remember, a factor of 100 in brightness is equivalent to a difference of five magnitudes. Therefore a star would brighten five magnitudes bringing it from 100 pc to 10 pc, so 6-5=1. The star has an absolute magnitude M =1.
Calculating absolute magnitudes M.The previous example was based on numbers chosen to work out simply. In general the problem requires a more complicated formula involving logarithms: m-M = 5 log d - 5where m = the apparent magnitude M = the absolute magnitude d = the distance in parsecsThe distance modulus, DM = m-M, is often used as a measure of distance. For every increase of 0.5 in DM, a star gets 10 times further away.The absolute magnitude of the sun is M = +5.
To summarize:How bright a star really is (its absolute magnitude M) depends on bright it appears (its apparent magnitude m, which can be directly measured) and how far away it is.Once again the central problem of astronomy- distance- is all important
The Spectra of StarsIn the early 1900’s it was recognized that though there was a tremendous variety of different kinds of spectra for stars, many could sorted into specific groups or classes based on the appearance of the features in their spectra. Stars typically have absorption line spectra, and the spectra range from those having only a few absorption lines to those with 1000’s of lines. Annie Jump Cannon developed the Harvard classification system and classified over 100,000 stars. Later it was realized that these spectral types could be arranged in a temperature sequence.
Spectral TypesThe original larger collection of spectral types was ultimately condensed to seven basic ones and arranged in a temperature sequence as shown: O, B, A, F, G, K, M hottest coolestThe O stars can have surface temperatures as high as 35,000o, while the M stars are in the 3000o range. The individual types are further subdivided into 10 subclasses, e.g., B0, B1,…B9, A0, A1, etc. Stars are classified by matching their spectra to standards for the various spectral types
Line strengths as a function of temperature and spectral type
Temperature and spectral typeThe absorption lines that are used to classify a star are formed in the atmospheric gases just above the dense outer region of the sun where the continuous radiation spectrum emerges from the opaque lower layers. The temperature in this layer determines two fundamentally important physical properties of the material in the gas:1) The amount that the various atoms are ionized.2) The amount different atoms or ions are excited, that is, the extent to which electrons will be found in excited energy levels in the atoms or ions.
Ionization, excitation, and temperature • Temperature measures motion, kinetic energy of gas particles. • Higher temperature means faster motions, higher energy per particle. • Collisions transfer energy to electrons, excite them to higher levels. • Higher temperatures, more energetics collisions lead to more highly excited electrons. • Higher temperatures, more energetic collisions lead to greater probability of ionization. Therefore higher temperature gasses are more highly excited and more ionized.
Ionization and excitation equationsSaha’s ionization equation gives the level of ionization of a given atom as a function of the temperature and density of the gas plus various physical properties of the atom or ion itself. Boltzmann’s excitation gives the expected distribution of electrons in various energy levels of a given atom or ion as a function of temperature plus various physical properties of the atom or ion.
Note about excitation and ionization:Electrons are constantly cascading down to lower energy levels and then being re-excited to higher levels or out of the atom in any single atom or ion. The Saha and Boltzmann equations are statistical. They give you (extremely accurate) values that you would expect to find if you averaged over a volume containing millions of atoms or particles.
An additional important remark on spectral types:Use the ionization and excitation equations and assume all stars have the same chemicalcomposition:Then the entire range of spectral types is understood as a temperature sequence. You only need to change the temperature to get from O-type through the sequence to M-type.
Colors of starsYou may recall Wien’s Law, which described the relationship of temperature to wavelength of maximum light output:It can be illustrated as follows:
Astronomers can use filters to measure the brightness of stars in different wavelength ranges (different colors) and thus get a color measurement for stars. This is a quick way to get a rough measure of the temperature of a star and thus a rough measure of the spectral type.
The Hertzsprung-Russell (H-R) Diagram:Based on two intrinsic properties of stars we can measure:1) Intrinsic light output- absolute magnitudeRemember: this requires both apparent magnitude and distance.2) Temperature- spectral type.The H-R diagram is a plot of M vs. spectral type.
A H-R diagram that includes many visible and nearby stars. The red line is called the “main sequence” and is the location where the vast majority of stars would be plotted on the diagram.
Stars in different parts of the H-R diagram are given different designations (note T across the top): “Bright giants” are more often called “intermediate supergiants.” Ovals indicate position where most are found
Complete spectral classification: classification includes spectral (temperature) class and luminosity class.1) Spectral class: O, B, A, F, G, K, M2) Luminosity class: I- supergiants II- intermediate supergiants III- giants IV- sub-giants V- dwarfsExamples: Sun G2 V, Antares M2 I, Sirius A0 VO5 V star, a dwarf, puts out about the same amount of light as an M2 I supergiant. What is going on here?
Place on the H-R diagram is determined by two things: temperature and intrinsic brightness or energy output.The energy output itself is determined by two things:1) The energy output per unit area on the surface of the star.2) The amount of surface area of the star, that is, its size.The surface area of a star is given by where A is the area and R is the radius of the star.
The intrinsic brightness or energy output is generally called the luminosity, L.L is determined by the energy output per unit area, E, times the total area of the star, A. Remember, the energy output per unit area is given by the Stefan-Boltzmann equation:The area is, as we have seen,and therefore the luminosity L of a star is given by
Luminosity dependence on radius and temperature:Let us compare two stars with the full formula:
A supergiant can have the same spectral type and and hence temperature as the sun, but put out 10,000 times as much light. If it is the same temperature, the only way it can do this is to have 10,000 times as much area or 100 times the radius.In like manner, a O star on the main sequence can have the same luminosity as a red supergiant. Since the O star is roughly 10 times hotter, each unit of surface area puts out 10,000 times as much energy. To have the same energy output as the red supergiant, it must have a surface area 10,000 times less, or a radius 100 times less. Thus we see that stellar radius increases diagonally to the upper right in the H-R diagram.
Now we can see why some stars are called supergiants and othersdwarfs.
Luminosity indicators:The degree of ionization is determined by the (1) temperature and (2) the density or pressure (pressure is proportional to density times temperature). A higher density at the same temperature leads to a lower ionization- recombination goes faster- while the converse is true at lower density. Because supergiants are so large compared to dwarfs, their surface gravities are lower and hence their atmospheric pressures and densities are lower. This leads to higher ionization at the same temperature. Certain spectral lines are quite sensitive to density and pressure and can be used to distinguish among supergiants, giants, and dwarfs.
Two-dimensional spectral classificationAn experienced spectroscopist can classify both the spectral type and the luminosity class of a star from its spectrum. This is extraordinarily valuable, as it means that, just from the spectrum of a star, one can plot it in on the H-R diagram.BUT: if you can plot a star on the H-R diagram, you know its absolute magnitude! And if you know its absolute magnitude and how bright it appears, its apparent magnitude, then you can calculate its distance!!This is called the method of spectroscopic parallaxes, which is a silly name. It would better be called the method of spectroscopic distances.
The calibration of the full H-R diagram: clusters to the rescue! • Many stars of many spectral types have examples close enough to get distance from parallaxes. • Some types of stars are rare, e.g., O stars, M supergiants, there are no nearby examples, and hence no parallax distances. • Not possible to derive absolute magnitudes for these rarer stars without direct distance measures. • But…many stars are found in clusters. • Clusters small, so can assume all the stars in them to be at the same distance.
Cluster main sequence fitting: by using overlapping parts of the main sequence of different clusters, it is possible to calibrate the absolute magnitudes of rarer stars only found in distant clusters.
Masses of starsMasses of stars are derived from observations of binary stars, stars in orbit around one another. The fundamental idea is to use Kepler’s Third law as modified by Newton:If the period of the binary is measured in earth years and the orbital size is measured in astronomical units (au), then the masses will be in terms of the sun’s mass. To measure the size of the orbit in au requires a knowledge of the distance.However, this only gives the sum of the masses. To get the individual masses, one must find out something about the position of the center of mass or motion with respect to the center of mass of the system. This will give the ratio of the masses and allow one to compute the masses individually.
Types of binary stars:I) Visual binaries- you see both stars. Orbit of visual binary
II) Spectroscopic binary stars- these stars appear as a single star because they too close together to be seen as two from the earth. They reveal their binary nature by periodic Doppler shifts of their spectral lines as they orbit one another. They come in two kinds:1) Single-line. In this case the spectrum of only one star is visible, and its velocity changes as it goes around its orbit.2) Double-line. In this case spectral lines from both stars are visible.
Double-line binary (cont):From the period and the velocities we can derive the circumferences and hence the actual sizes of the orbits. The relative velocities tell us the ratio of the masses, and thus we have everything we need to calculate the individual masses.Not quite! We don’t know the inclination of the orbital plane to the line of sight. If the orbits are seen edge-on, then we see the full velocity. If we were to observe the binary from a direction perpendicular to the orbit plane, we wouldn’t see any shift at all: the orbital velocities would be across the line of sight, not along it. Since there is no way to determine the inclination of the orbital plane, we only have a rough estimate of the mass, or at best, a statistical estimate.Unless…the orbit is edge-on and the stars eclipse one-another!!
Double-line eclipsing binary stars- the answer to an astronomer’s dream.
Now we have: • The radial velocity curve for each star. • We know the inclination- the orbit is effectively edge-on. • We know the time it takes for various things to happen: • The period of mutual revolution. • The time it takes for each star to go from the beginning of an eclipse to a complete eclipse. • The time a star spends in eclipse (transit).
From this we can derive • The masses of the individual stars. • The radius of each star. • The shapes (eccentricity) of the orbits. • Sometimes something about the shapes of the stars or distribution of brightness on the surfaces of the stars.