Download
1 / 23
230 likes | 349 Views
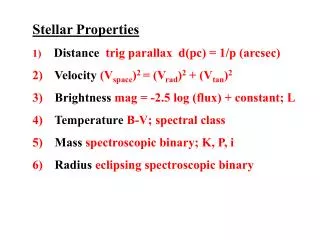
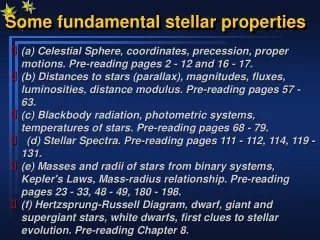
Stellar Properties. List of useful properties for understanding how stars work The are….?. In order, most important first…. Mass Luminosity Size Surface temperature Chemical composition Distance, brightness. Want distance? Measure the parallax angle….

E N D
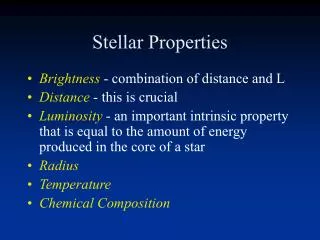
Stellar Properties • List of useful properties for understanding how stars work • The are….?
In order, most important first… • Mass • Luminosity • Size • Surface temperature • Chemical composition • Distance, brightness
Want distance? Measure the parallax angle… • The basic idea: Closer objects shift in direction through a bigger angle than do farther ones • Simple geometry gives the formula… • Distance = 1/(parallax angle) • Must use the right units here: define a new distance unit, for convenience… a parsec • Typical parallax shift for the nearest stars… less than one arc second! That’s REALLY tiny and hard to measure • Distances are the HARDEST thing we do in astronomy!
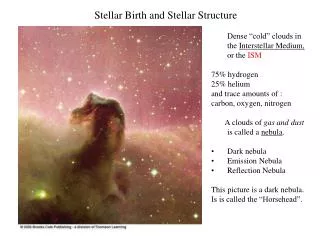
Spectral Types and Surface Temperature • In the late 1800’s, Annie Jump Cannon at Harvard found patterns in the growing collection of stellar spectra • This is pre-quantum mechanics, pre-discovery of the atom, electron orbitals etc., so… we had NO idea what spectral lines meant. • She found…
The Random Walk towards the Spectral Types… • White Stars, with prominent hydrogen lines. Called them “A stars.” • Blue-white stars, with less prominent H lines, and weak helium lines. Called them “B stars” • Then, no more in this color direction, so skip some letters and… Cream colored stars, with weaker H lines and lots of very weak other lines. Called them “F stars” • Yellow stars, with prominent double line in the yellow part of spectrum. Called them “G stars”. • Orange stars, with very weak H lines and tons of other lines. Skip some more letters and call them “K stars”. • Red stars, with no H lines, tons of lines, even big thick bands of light taken out by what we now know as TiO. Skip L and call them M stars • Then, by now, found a few stars very blue and with very weak H lines and strong He lines, and nothing else. Call them O stars.
Voila’! The Spectral Sequence! • OBAFGKM from hot to cool. Memorize it! • Now we know it’s a surface temperature sequence, nothing to do with chemical composition (which is about the same for all stars) • “Oh, Be A Fine Girl, Kiss Me!” • Don’t blame me, it’s been around for a hundred years!
Ah, So Now We’ve got Two Fundamental Properties of Stars… • Make a Scatter Plot! Plot one against the other and see if any interesting pattern shows up • This is, the Hertzsprung Russell Diagram – a fundamental tool of stellar astronomy • Making the first one was HARD! • Had to carefully measure photographs distance for a bazillion stars, trying to find that tiny few which had detectable parallax shifts, which gives distance, which then gives luminosity (when combined with brightness)
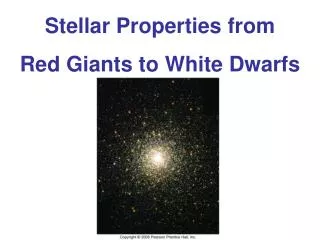
Stellar Demographics • Note, a given volume of space has a “fair sample” of what kind of stars are out there. Mostly dim, reddish stars • Looking at a brightness-limited sample is what you end up doing when you look at the night sky – you see everything above some limiting brightness accessible to your eye or telescope. This is a very Unfair sample! • It’s heavily skewed toward the most luminous stars, which you can see from much farther away and hence sampling a much bigger volume of space • HR diagram dominated by the Main Sequence
About 10% of the stars are not on the Main Sequence. Let’s come up with some good names for them, through Pure Reason! • …..
The H-R Diagram 90% of stars fall on the Main Sequence Main Sequence Stars = core hydrogen fusion stars HR diagram can be used to show stellar evolution. We’ll do this in the next chapter
How Do We Find the Mass of Stars? • Or better to ask… what directly observable things could we measure which depend sensitively and directly on mass? • The motivation is to be able to discover what physics is relevant by first GETTING the mass. So, we want a context which gives mass directly, without massive amounts of poorly constrainted physics.