Download
1 / 26
270 likes | 374 Views
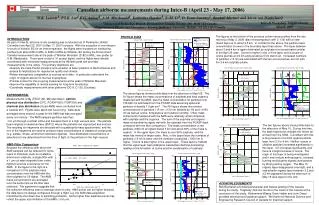
Ozone and Aerosol Measurements with Airborne Lidar During the INTEX-NA Field Experiment: Initial Results Edward V. Browell, Johnathan W. Hair, Carolyn F. Butler, Marta A. Fenn, Anthony Notari, Susan A. Kooi, and Syed Ismail Sciences Directorate NASA Langley Research Center

E N D
Ozone and Aerosol Measurements with Airborne Lidar During the INTEX-NA Field Experiment: Initial Results Edward V. Browell, Johnathan W. Hair, Carolyn F. Butler, Marta A. Fenn, Anthony Notari, Susan A. Kooi, and Syed Ismail Sciences Directorate NASA Langley Research Center Hampton, Virginia INTEX-NA Workshop 29 March - 1 April 2005
Airborne Ozone & Aerosol Lidar Measurements Nadir and Zenith Measurements • Ozone Profiles (ON = 288 nm & OFF =300 nm) • Aerosol Backscatter Ratios Profiles (1064, 600, 300 nm) • Aerosol Depolarization Ratio Profiles (600 nm)
S. Pt Ron Brown & J-31 N. Pt 22 July 2004 (Flight #11) River of Pollution
S. Pt Ron Brown & J-31 N. Pt 22 July 2004 (Flight #11) River of Pollution
S. Pt Ron Brown & J-31 N. Pt 22 July 2004 (Flight #11) River of Pollution (PV from Brad Pierce)
S. Pt Ron Brown & J-31 N. Pt Highest 125 ppbv Altitudes Tropopause Altitudes 22 July 2004 (Flight #11) River of Pollution
S. Pt Ron Brown & J-31 N. Pt O3 ColumnsSurface to 125 ppbv (2 x DU scale) O3 Tropospheric Columns (2 x DU scale) 22 July 2004 (Flight #11) River of Pollution
S. Pt Ron Brown & J-31 N. Pt Surface to 4 km 4 to 8 km 8 km to tropopause 22 July 2004 (Flight #11) River of Pollution
N. Pt S. Pt Ron Brown & J-31 22 July 2004 (Flight #11) River of Pollution PV from RAQMS Model (Brad Pierce) Backtrajectories from FSU (Henry Fuelberg)
S. Pt Ron Brown & J-31 N. Pt 22 July 2004 (Flight #11) River of Pollution
S. Pt Ron Brown & J-31 N. Pt Cirrus Clds. Fire Plumes Low Depol. Aerosols 22 July 2004 (Flight #11) River of Pollution
S. Pt Ron Brown & J-31 N. Pt Small Backgnd Aerosols Fire Plumes Large Aerosols 22 July 2004 (Flight #11) River of Pollution
18 July 2004 (Flight #9) U.S. Outflow DC-8 Flight Track Fire Plumes Expected Convective Outflow Expected All Over Region Urban Plumes Expected
Large Fire Plumes Observed Evidence of Upstream Convective Outflow Urban Plume 18 July 2004 (Flight #9) U.S. Outflow
Large Fire Plumes Observed Region of Upstream Convective Outflow 18 July 2004 (Flight #9) U.S. Outflow
20 July 2004 (Flight #10) Alaskan Smoke Plumes DC-8 Flight Track Fire Plumes Expected
20 July 2004 (Flight #10) Alaskan Smoke Plumes S. Pt. NW Pt. Penn. Fire Plumes
Asian Air Expected in Mid to Upper Trop. CA Pollution Expected in Lower Trop. 1 July 2004 (Flight #3) Asian & CA Outflow DC-8 Flight Track
Asian Outflow California Pollution Clean Marine 1 July 2004 (Flight #3) Asian & CA Outflow Expected Asian Outflow California
140-126W 100-80W 80-60W 60-35W INTEX-NA: 1 July - 14 August 2004 (18 Flights)
INTEX-NA: Average Latitudinal O3 Distributions (80-60W) All Tropospheric Ozone
B C D A INTEX-NA: Average Latitudinal Tropospheric Ozone Distributions A: 140-126W B: 100-80W C: 80-60W D: 60-35W
INTEX-NA: Average Longitudinal O3 Distributions (25-55N) All Tropospheric Ozone
Preliminary Results • Obtained large-scale distributions of O3 and aerosol characteristics from near surface to mid-trop./lower strat. on all but one INTEX-NA flights. • Observed long-range transport of Asian pollution with enhanced aerosols and O3 in mid-upper trop. in the eastern Pacific to possibly eastern U.S. • Observed variable tropopause levels and presence of stratospheric air mixed with polluted air masses from up wind convection. • Observed enhanced aerosols and O3in lower troposphere associated with pollution over the U.S. and advection over Atlantic. • Observed aerosol characteristics & long-range transport of Alaskan fire plumes to mid, eastern, and northeastern U.S. in layers which mixed into PBL in some cases and Saharan dust over southern U.S. • Determined the average latitudinal & longitudinal O3 distributions for examining the continental scale variations observed during INTEX. All INTEX data images available at http://asd-www.larc.nasa.gov/lidar/
Future Activities • Determine the average aerosol lat. & long. distributions to correlate with the average O3 lat. & long. distributions. • Complete air mass categorization based on O3 , aerosol characteristics, and potential vorticity levels, vis-à-vis, TRACE-P. • Determine fraction of time each air mass type was observed and the relative contribution of each air mass type to trop. O3 budget. • Determine chemical characteristics of each air mass type based on in situ measurements of the remotely categorized air masses. • Determine the eastward flux of O3 observed over eastern North America and western Atlantic (80-60W). • Compare O3 and aerosol results with model predictions. • Compare large-scale average O3 and aerosol distributions, air mass types, and fluxes with previous field experiments. • Collaborate with Science Team in chemistry/transport process studies and satellite & model validation activities. See posters by Fenn et al. and Butler et al. for additional O3 and aerosol results!