Download
1 / 17
170 likes | 179 Views
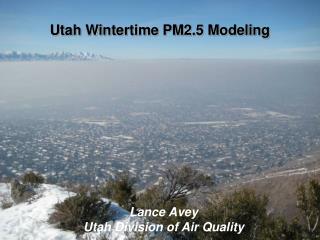
Utah Wintertime PM2.5 Modeling. Lance Avey Utah Division of Air Quality. http://www.airquality.utah.gov/. PM2.5 Speciation. Dust 2%. Elemental Carbon 5%. Other 5%. Organic Carbon 20%. Ammonium Nitrate 58%. Ammonium Sulfate 9%. NOx + VOCs. HNO 3 (nitric acid).

E N D
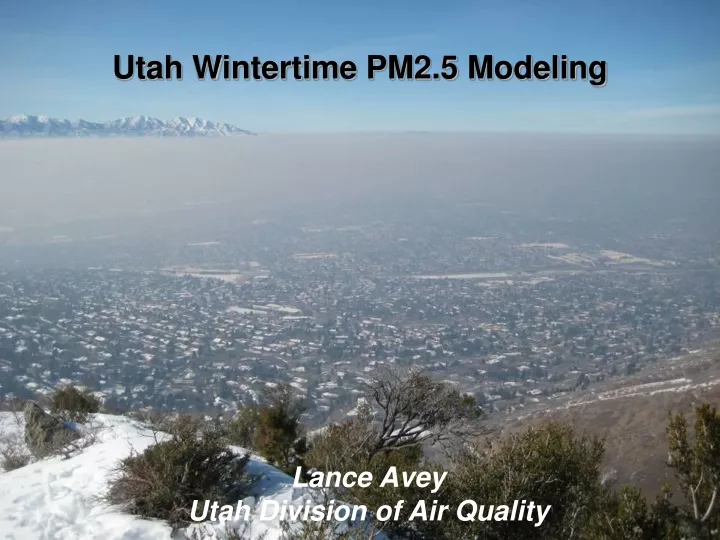
Utah Wintertime PM2.5 Modeling Lance Avey Utah Division of Air Quality
PM2.5 Speciation Dust 2% Elemental Carbon 5% Other 5% Organic Carbon 20% Ammonium Nitrate 58% Ammonium Sulfate 9% NOx + VOCs HNO3 (nitric acid) HNO3 + NH3 NH4NO3 (particulate)
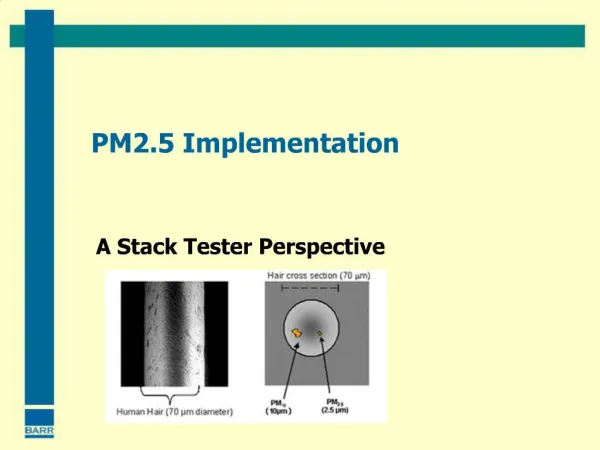
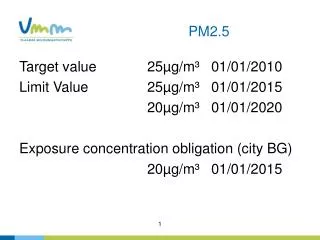
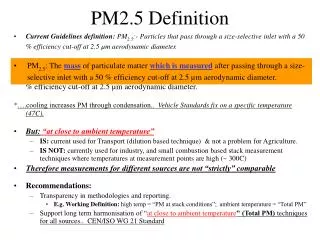
NAAQS for PM2.5 • EPA revised the NAAQS for PM2.5 in December of 2006 • 24-hr standard was lowered from 65 micrograms per cubic meter (µg/m3) to 35 µg/m3 • Annual standard was retained at 15 µg/m3 • Retained the 24-hr standard for PM10 at 150 µg/m3
State Implementation Plan • Basic Elements include: • Modeled Attainment Demonstration (with chemistry) • Emissions Inventories • Emission Limits • Attainment Dates (2 – 7 years after SIP)
Retrospective Modeling • Replicate the meteorological, emissions, and chemistry of past high PM2.5 episodes • In the future, the same meteorology and chemistry will cause high PM2.5 episodes • Future emissions will change • Population Growth, new technologies, cleaner vehicles • Allows DAQ to evaluate how future changes in emissions (and control strategies) effect PM2.5
Emissions Point, Area, Mobile
UDAQ RetrospectiveWRF • 36/12/4 km Horizontal Domain • 37 vertical layers • 1st layer at ~ 12 meters • 10 layers below 250 meters • Initialization uses 12km-NAM Re-analysis • Pleim-Xiu LSM & Surface Layer, ACM2 PBL • Simulations were ran in 5.5 day segments • Observational and Analysis Nudging
Modeling Domain 4km x 4km
WRF Output 2010 Jan 04 – Midnight Local Time
CMAQ Nitrate (ug/m3) 2010 Jan 04 – Midnight Local Time
Future Year Modeling • Same Meteorology • Same Chemistry • Changes in Emissions