Download
1 / 21
220 likes | 241 Views
INFRA RED SPECTROSCOPY. CONTENTS Prior knowledge Origins of infra red spectra Vibrations of bonds in molecules The Infra Red spectrophotometer Uses of IR Interpretation of IR spectra Characteristic absorption frequencies Check list. INFRA RED SPECTROSCOPY.

E N D
INFRA RED SPECTROSCOPY • CONTENTS • Prior knowledge • Origins of infra red spectra • Vibrations of bonds in molecules • The Infra Red spectrophotometer • Uses of IR • Interpretation of IR spectra • Characteristic absorption frequencies • Check list
INFRA RED SPECTROSCOPY • Before you start it would be helpful to… • know the names and structures of organic functional groups
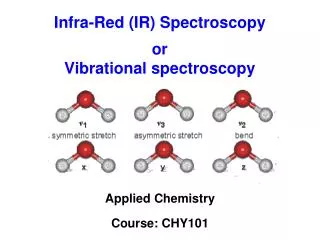
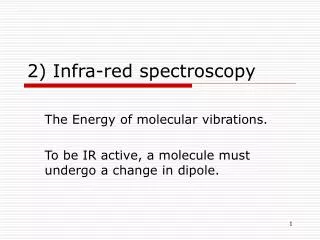
INFRA RED SPECTROSCOPY Different covalent bonds have different strengths due to the masses of different atoms at either end of the bond. As a result, the bonds vibrate at different frequencies The frequency of vibration can be found by detecting when the molecules absorb electro-magnetic radiation. Various types of vibration are possible.
INFRA RED SPECTROSCOPY Different covalent bonds have different strengths due to the masses of different atoms at either end of the bond. As a result, the bonds vibrate at different frequencies The frequency of vibration can be found by detecting when the molecules absorb electro-magnetic radiation. Various types of vibration are possible. Examples include... STRETCHING and BENDING SYMMETRIC BENDING ASYMMETRIC STRETCHING STRETCH
BENDING AND STRETCHING IN WATER MOLECULES SYMMETRIC STRETCHING
BENDING AND STRETCHING IN WATER MOLECULES ASYMMETRIC STRETCHING
The Infra-red Spectrophotometer • a beam of infra red radiation is passed through the sample • a similar beam is passed through the reference cell • the frequency of radiation is varied • bonds vibrating with a similar frequency absorb the radiation • the amount of radiation absorbed by the sample is compared with the reference • the results are collected, stored and plotted
The Infra-red Spectrophotometer A bond will absorb radiation of a frequency similar to its vibration(s) normal vibration vibration having absorbed energy
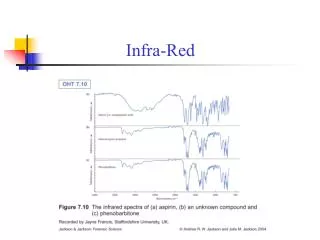
INFRA RED SPECTRA - USES IDENTIFICATION OF PARTICULAR BONDS IN A MOLECULE The presence of bonds such as O-H and C=O within a molecule can be confirmed because they have characteristic peaks in identifiable parts of the spectrum.
INFRA RED SPECTRA - USES IDENTIFICATION OF PARTICULAR BONDS IN A MOLECULE The presence of bonds such as O-H and C=O within a molecule can be confirmed because they have characteristic peaks in identifiable parts of the spectrum. IDENTIFICATION OF COMPOUNDS BY DIRECT COMPARISON OF SPECTRA The only way to completely identify a compound using IR is to compare its spectrum with a known sample. The part of the spectrum known as the ‘Fingerprint Region’ is unique to each compound.
INFRA RED SPECTRA - INTERPRETATION Infra-red spectra are complex due to the many vibrations in each molecule. Total characterisation of a substance based only on its IR spectrum is almost impossible unless one has computerised data handling facilities for comparison of the obtained spectrum with one in memory. However, the technique is useful when used in conjunction with other methods such as nuclear magnetic resonance (nmr) spectroscopy and mass spectroscopy. Peak position depends on bond strength masses of the atoms joined by the bond strong bonds and light atoms absorb at lower wavenumbers weak bonds and heavy atoms absorb at high wavenumbers
INFRA RED SPECTRA - INTERPRETATION Vertical axis Absorbance the stronger the absorbance the larger the peak Horizontal axis Frequency wavenumber (waves per centimetre) / cm-1 Wavelength microns (m); 1 micron = 1000 nanometres
FINGERPRINT REGION • organic molecules have a lot of C-C and C-H bonds within their structure • spectra obtained will have peaks in the 1400 cm-1 to 800 cm-1 range • this is referred to as the “fingerprint” region • the pattern obtained is characteristic of a particular compound the frequency of any absorption is also affected by adjoining atoms or groups.
IR SPECTRUM OF A CARBONYL COMPOUND • carbonyl compounds show a sharp, strong absorption between 1700 and 1760 cm-1 • this is due to the presence of the C=O bond
IR SPECTRUM OF AN ALCOHOL • alcohols show a broad absorption between 3200 and 3600 cm-1 • this is due to the presence of the O-H bond
IR SPECTRUM OF A CARBOXYLIC ACID • carboxylic acids show a broad absorption between 3200 and 3600 cm-1 • this is due to the presence of the O-H bond • they also show a strong absorption around 1700 cm-1 • this is due to the presence of the C=O bond
IR SPECTRUM OF AN ESTER • esters show a strong absorption between 1750 cm-1 and 1730 cm-1 • this is due to the presence of the C=O bond
O-H STRETCH AND C=O STRETCH WHAT IS IT! One can tell the difference between alcohols, aldehydes and carboxylic acids by comparison of their spectra. ALCOHOL O-H STRETCH ALDEHYDE C=O STRETCH CARBOXYLIC ACID
CHARACTERISTIC FREQUENCIES N-H CN C-Cl O-H C=O C-O C-H Aromatic C-C C=C C-C alkanes
CHARACTERISTIC ABSORPTION FREQUENCIES • Bond Class of compound Range / cm-1 Intensity • C-H Alkane 2965 - 2850 strong • C-C Alkane 1200 - 700 weak • C=C Alkene 1680 - 1620 variable • C=O Ketone 1725 - 1705 strong • Aldehyde 1740 - 1720 strong • Carboxylic acid 1725 - 1700 strong • Ester 1750 - 1730 strong • Amide 1700 - 1630 strong • C-O Alcohol, ester, acid, ether 1300 - 1000 strong • O-H Alcohol (monomer) 3650 - 3590 variable, sharp • Alcohol (H-bonded) 3420 - 3200 strong, broad • Carboxylic acid (H-bonded) 3300 - 3250 variable, broad • N-H Amine, Amide 3500 (approx) medium • CN Nitrile 2260 - 2240 medium • C-X Chloride 800 - 600 strong • Bromide 600 - 500 strong • Iodide 500 (approx) strong