Download
1 / 10
100 likes | 127 Views
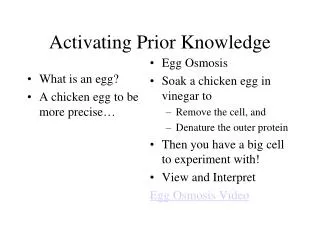
Prior Knowledge. The unit of measure of energy in an ecosystem is one you can readily find by looking on just about any package of food you buy or eat – How is food energy measured? What do Calories measure? What would efficiency measure in ecology? How do you use your energy?.

E N D
Prior Knowledge • The unit of measure of energy in an ecosystem is one you can readily find by looking on just about any package of food you buy or eat – • How is food energy measured? • What do Calories measure? • What would efficiency measure in ecology? How do you use your energy?
Pyramids as Models - Pyramids model the distribution of energy and matter in an ecosystem.
Use a pyramid to: • Trace the flow of energy through an ecosystem • Relate food chains and trophic levels • Compare and contrast a biomass pyramid and a pyramid of numbers
Types of Pyramids • 1. Energy Pyramid • 2. Biomass Pyramid • 3. Pyramid of Numbers
Energy Pyramid energy Lost = 90% energy transfer = 10% An energy pyramid shows the distribution of energy among trophic levels. • ALWAYS A NORMAL PYRAMID • Energy pyramids compare energy used by organisms on each trophic level. • Between each tier of an energy pyramid, about 90 percent of the energy is lost. • Only 10 percent of the energy is transferred from one trophic level to the next.
Biomass Pyramid tertiary consumers 75 g/m2 150g/m2 secondary consumers primary consumers 675g/m2 2000g/m2 2000g/m2 producers producers Other pyramid models illustrate an ecosystem’s biomass and distribution of organisms. • Biomass is a measure of the total dry mass of organisms in a given area at ONE time.
Biomass Pyramids What would change the shape of the biomass pyramid? Normal Pyramid Irregular Pyramid
Pyramid of numbers 5 tertiary consumers secondary consumers 5000 primary consumers 500,000 producers 5,000,000 producers 5,000,000 • A pyramid of numbers shows the numbers of individual organisms at each trophic level in an ecosystem. • A vast number of producers are required to support even a few top level consumers.
Pyramids of Numbers What would change the shape of a pyramid of numbers? Normal Pyramid Irregular Pyramid 1 Irregular Pyramid 2
Calculations How do you move up and down the trophic levels for a NORMAL PYRAMID? • To move up the pyramid from a lower trophic level to the next trophic level above it: multiply by 0.1 or divide by 10 • To move down the pyramid from a higher trophic level to the trophic level directly below it: multiply by 10 or divide by 0.1 20 x 0.1= 2 20 ÷ 10 = 2 20 2 2 x 10 = 20 2 ÷ 0.1 = 20