Download
1 / 17
170 likes | 406 Views
Designing a Query Tool for Time Series Data in ArcGIS Hydro Data Model. By Reem Jihan Zoun. Outline. Time Series in ArcHydro Populating Time Series Table Scope for a Load Data Tool Query Data Tool –Purpose and Design Conclusion and Future Work. What is Time Series Data?.

E N D
Designing a Query Tool for Time Series Data in ArcGIS Hydro Data Model By Reem Jihan Zoun
Outline • Time Series in ArcHydro • Populating Time Series Table • Scope for a Load Data Tool • Query Data Tool –Purpose and Design • Conclusion and Future Work
What is Time Series Data? Data values that have time component to it or are continuous in time are Time Series Data. Example of Time Series Data important in hydrology: • Year’s rainfall • Stream flow • Evaporation • Water level in a stream
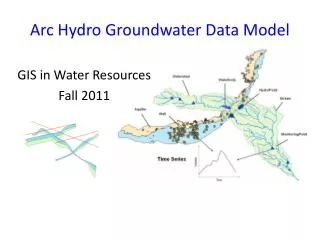
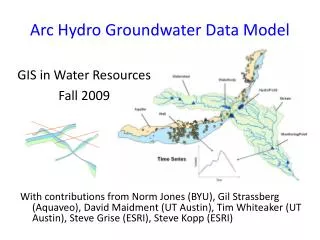
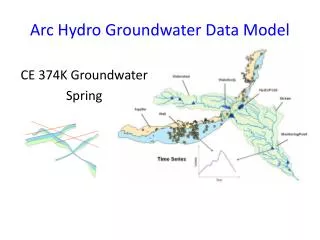
Time Series in ArcGIS Hydro Data Model • Time Series Component in ArcGIS Hydro Data model (ArcHydro) was intended to allow for the storage, access, display and analysis of Time Series data. • It consists of two object classes and one relationship. • They are stored in the Time Series and TSTypeInfogeodatabase table. • The relationship exists between the TimeSeries and TSTypeInfo object classes.
Populating TimeSeries Table In order to populate the TimeSeries Table for the purpose of this exercise, time series data were loaded manually which comprised the following three step process: • Get Data from USGS website • Formatting the Dataset in MicroSoft Excel • Import of Data to Time Series table in MsAccess
758 data values for each data type for 7 day period ! 08176500Station Number forVictoriaGaging Station Step 1: Get Data from USGS website
Real Time Data for Victoria Gaging Station(USGS table format)
Step 2: Formatting the Dataset in Excel • HydroID for Victoria station is 500001 which is assigned in the FeatureID field. • Values for both Gage Height and Stream flow data types go to TSValue field. • TSTypeID value of 101 was assigned to Gage Height and 102 was assigned to Stream Flow.
Step 3: Copy Data to Time Series table in MsAccess • The TimeSeries table was opened in MS Access to copy data from the formatted Excel spreadsheet. • The tables looked like this after loading data:
Scope for a Load Data Tool • The manual process of loading limited amount of data to the TimeSeries table is quite tedious. • As the size of the dataset will increase, it would be virtually impossible to retrieve these data manually. • Creation of a tool for loading data to the TimeSeries table will make the process substantially easier. • There is an existing tool to retrieve stream flow data from USGS website named NWIS. • The NWIS tool specifies the station number and then submits request for data set on the USGS website. All this happens in the background and we don’t even have to open the website.
Purpose of the Query Tool • All the time series data is stored in one large file regardless of feature type and the type of data stored in it • Three variables: Feature Classes, Data Types & Time Period “The objective of the query tool is to display any particular subset of the database forFeature Class, Data TypeandTime Perioddefined bythe user.”
Conclusion and Future Work • Query Data tool will have a very important role in fulfilling the purpose of Time Series Component specially in terms of access, display and analysis. • At present the Query Data tool has user interfaces created with ArcMap and Visual Basic but it doesn’t have any functionality. • Important future work is to write code for the Query Data Tool.
Acknowledgement • Dr. Maidment for getting me in to the exciting world of Tools and Visual Basic. • Tim Whiteaker • Venkatesh Merwade • The CRWR crew, it’s always fun to work there!!