Download
1 / 74
750 likes | 908 Views
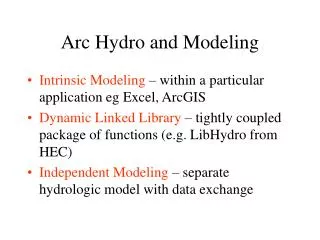
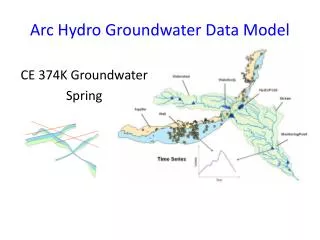
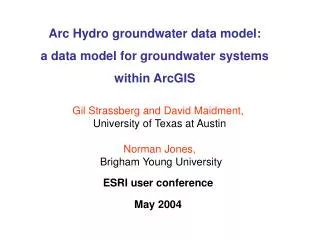
Arc Hydro Groundwater Data Model. Gil Strassberg University of Texas at Austin. Outline. Background: objectives, previous design New design and books, Framework Groundwater components Examples. What is a hydrologic data model?.

E N D
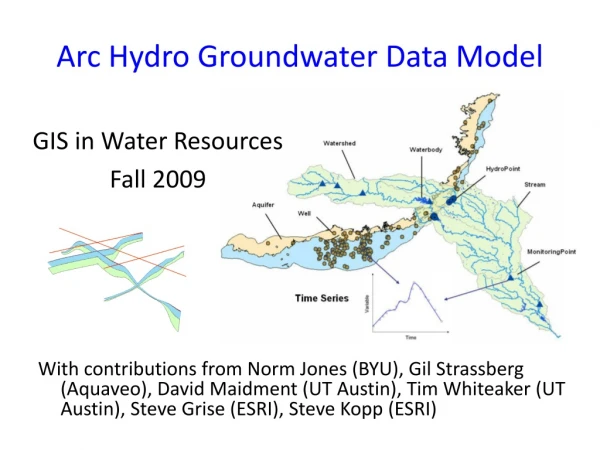
Arc Hydro Groundwater Data Model Gil Strassberg University of Texas at Austin
Outline • Background: objectives, previous design • New design and books, Framework • Groundwater components • Examples Pre Conference Seminar
What is a hydrologic data model? Booch et al. defined a model: “a simplification of reality created to better understand the system being created” Objects Aquifer stream Well Volume R.M. Hirsch, USGS Pre Conference Seminar
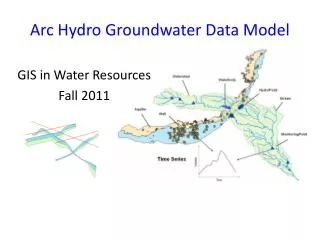
Developing a groundwater data model Take a variety of spatial information and integrate into one geospatial database with a common terminology • Better communication • Integration of data • Base for applications Geologic maps Time series observations Borehole data Groundwater data model (geospatial database) Hydrostratigraphy Geospatial vector layers Numerical models Gridded data Pre Conference Seminar
Goals of the Arc Hydro groundwater data model Objective: Develop a geographic data model for representing groundwater systems. Data model goals: • Support representation of regional groundwater systems. • Support the representation of site scale groundwater data. • Enable the integration of surface water and groundwater data. • Facilitate the Integration of groundwater simulation models with GIS. Pre Conference Seminar
Regional groundwater systems • Describe groundwater systems from recharge to discharge • In many cases assumed as 2D systems, vertical scale >> horizontal scale Pre Conference Seminar
Site scale data • Describe groundwater data in a small area of interest. • Usually includes 3D data (e.g. multilevel samplers, cores). Multilevel samplers in the MADE site in Mississippi Photographs provided by Chunmiao Zheng Pre Conference Seminar
Integration of surface water and groundwater data • Describe the relationship between surface water features ( e.g. streams and waterbodies) with groundwater features (aquifers, wells). • Enable the connection with the surface water data model Hydro network Aquifers Pre Conference Seminar
Integration of groundwater simulation models with GIS • Define data structures for representing groundwater simulation models within GIS. • Support spatial and temporal referencing of model data – allows the display and analysis of model data within a “real” geospatial and temporal context. • Focus on modflow as the standard model used in the groundwater community Non spatial representation (layer, row, column) Geospatial representation (x, y, and z coordinates) Pre Conference Seminar
Old design One big geodatabase with 3 conceptual components: Hydrogeology, Simulation, Temporal Pre Conference Seminar
Outline • Background: objectives, previous design • New design and books, Framework • Groundwater components • Examples Pre Conference Seminar
New Design • Better integrate surface water and groundwater • Easier implementation • Solution: • One framework – including basic surface water and groundwater features • Componentize the data model smaller thematic pieces Pre Conference Seminar
Components Components can be added to the framework to represent specific themes in more detail Surface water components Groundwater components Network Wells and boreholes Framework Drainage Hydrostratigraphy Hydrography Geology Chanel Simulation Temporal (enhanced) Temporal component Pre Conference Seminar
Two books Pre Conference Seminar
Framework Groundwater features Surface water features TimeSeries Pre Conference Seminar
Framework Watershed Waterbody HydroPoint Stream Aquifer Well MonitoringPoint Time Series Pre Conference Seminar
Surface water and groundwater • In many cases collected and stored separately • Store, visualize, and analyze in the same conference Well in the Edwards Aquifer (state well 6823302) Streamflow Gage at Comal Springs, New Braunfels Texas Pre Conference Seminar
Aquifer features • Polygon features for representing aquifer boundaries and zones within them Map of major aquifers in Texas Edwards Aquifer Pre Conference Seminar
Aquifer features • An aquifer is defined by one or a set of polygon features • Aquifer features can be grouped by a hydrogeologic unit id (HGUID) • FType for defining types of aquifer features Pre Conference Seminar
Well features Well 1729 State well number 6829103 Types of wells • Wells represented as 2D point features • Can be related with a certain Aquifer • FType for defining types of wells Pre Conference Seminar
Hydro Features • HydroID – Unique ID within the geodatabase (internal relationships) – Every feature in Arc Hydro is assigned a unique HydroID • HydroCode – Public identifier (external relationships) Pre Conference Seminar
HydroCode links to external applications • Web interface for groundwater data in Texas • Texas Water Information Integration & Dissemination (WIID) The state well number becomes the HydroCode of the Well feature in Arc Hydro Pre Conference Seminar
Aquifer and well Well 1729 State well number 6829103 Pre Conference Seminar
Wells and TimeSeries Wellfeatures are related with time series (water levels, water quality) Pre Conference Seminar
Surface water features • Watershed – Polygon features for representing a drainage area • Stream – Line features representing the path of flow as linear hydrographic features (blue lines on a map) • Waterbody – Polygon features representing water bodies • HydroPoint – Point features for representing any point hydrographic feature (diversion, spring, dam, etc.) Pre Conference Seminar
MonitoringPoint has time series Monitoring points are related with time series (streamflow, water quality, precipitation) Pre Conference Seminar
Surface water – groundwater linkage • AquiferID is added to the surface water features • Surface water and groundwater features can be linked through the AquiferID and HydroID attributes • Work in progress –still trying to figure out exactly which relationships are needed Pre Conference Seminar
Surface water – groundwater linkage • Relationships between surface water and aquifer enable analysis based on spatial and hydrologic relationships Stream reaches overlying an aquifer outcrop Pre Conference Seminar
Outline • Background: objectives, previous design • New design and books, Framework • Groundwater components • Examples Pre Conference Seminar
Components • Geology - mostly representation of data from geologic maps • Wells and Boreholes – Description of well attributes and vertical data along wells • Hydrostratigraphy – 2D and 3D description of hydrostratigraphy • Temporal - Representing time series data • Simulation – Representation of groundwater simulation models Pre Conference Seminar
Geology Features for representing data from geologic maps Faults Caves Data from USGS report: http://pubs.usgs.gov/sim/2005/2873/ Pre Conference Seminar
Components • Geology - mostly representation of data from geologic maps • Wells and Boreholes – Description of well attributes and vertical data along wells • Hydrostratigraphy – 2D and 3D description of hydrostratigraphy • Temporal - Representing time series data • Simulation – representation of groundwater simulation models Pre Conference Seminar
Well • Wells are the most basic features in groundwater databases • Attributes of wells describe its location, depth, water use, owner, etc. • In many cases these data are collected from driller reports Pre Conference Seminar
Well • The Well location is defined as a 2D point in the Well feature class • In the Arc Hydro model we only predefine a set of basic attributes Wells in the Edwards Aquifer Pre Conference Seminar
Well • FType is a coded value domain • Can add/delete based on project requirements Pre Conference Seminar
Wells and 3D data • 3D data is referenced along the well • From depth (top) – To depth (bottom) From To Pre Conference Seminar
Wells and Boreholes • Vertical data (stratigraphy, casing) are related with wells • 3D information is stored as tabular data in the VerticalMeasurements table • Can create 3D features (points, lines) for visualization Pre Conference Seminar
Creating 3D displays • We can create 3D displays of wells with the elevation and depth attributes of the well feature Land surface Extruded well features Pre Conference Seminar
3D features (BorePoints and BoreLines) • Data on 3D intervals/points along the well Wells with hydrostratigraphic information Pre Conference Seminar
3D features (BorePoints and BoreLines) • Original data is in text format • Each data represents the top of a formation at one well Data from USGS report: http://pubs.usgs.gov/sir/2004/5226/ Pre Conference Seminar
Well HydroID = 3266 3D features (BorePoints and BoreLines) • Data on 3D intervals/points along the well are stored in tabular format • Data from the vertical measurements are related through the HydroID-WellID relationship Pre Conference Seminar
750 Upper confining unit 146 Georgetown Fm. (GTOWN) 128 Cyclic + Marine member (CYMRN) 41 Leached + collapsed member (LCCLP) -60 Regional dense member (RGDNS) -81 Grainstone member (GRNSTN) -140 Kirschberg evaporite member (KSCH) -217 Dolomitic member (DOLO) -372 Lower confining unit, upper Glen Rose (UGLRS) -433 3D features (BorePoints and BoreLines) • Combining the well geometry (x, y) and the vertical measurements we can describe a set of 3D geometries (x, y, z) Pre Conference Seminar
3D features (BorePoints and BoreLines) • BorePoints representing geologic contacts along wells • Each point represents the top of a hydrogeologic formation Well Land surface BorePoint Pre Conference Seminar
Well HydroID = 3266 BoreLines for well 3266 3D features (BorePoints and BoreLines) • BoreLines representing intervals along wells • Each line represents a hydrogeologic unit (top and bottom) BorePoints and BoreLines can also be used to represent other features along wells (construction, sampling ports, screens) Pre Conference Seminar
Components • Geology - mostly representation of data from geologic maps • Wells and Boreholes – Description of well attributes and vertical data along wells • Hydrostratigraphy – 2D and 3D description of hydrostratigraphy • Temporal - Representing time series data • Simulation – representation of groundwater simulation models Pre Conference Seminar
Geology to hydrogeology • Stratigraphic units are usually grouped into hydrogeologic units • An aquifer can have a number of hydrogeologic units • Definition may change based on scale (local vs. regional) and purpose Stratigraphic units Hydrogeologic units Upper confining unit Georgetown Fm. Georgetown Fm. (GTOWN) Cyclic + Marine member (CYMRN) Pearson Fm. Leached + collapsed member (LCCLP) Edwards Aquifer Regional dense member (RGDNS) Grainstone member (GRNSTN) Kirschberg evaporite member (KSCH) Kainer Fm. Dolomitic member (DOLO) Basal Nodular member (BSNOD) Upper Glen Rose (UGLRS) Pre Conference Seminar
Products and workflow Pre Conference Seminar
Hydrostratigraphy HydroGeologicUnit table provides a conceptual description of hydrogeologic units Spatial features Relates with spatial features representing instances of the HGU Pre Conference Seminar
HGUArea • 2D polygons defining boundaries of hydrogeologic units BorePoints representing top of hydrogeologic units Kainer boundary Georgetown boundary Pre Conference Seminar
HGUArea • A hydrogeologic unit can be represented by more than one HGUArea • HGUArea is related to the hydrogeologic units in the table through the HGUID attribute HydroID = 4706 HydroID = 4705 HydroID = 4707 Pre Conference Seminar