Download
1 / 15
150 likes | 326 Views
CMS Tracker: Detector Control Units & Tracker Monitoring. (A contribution to:). My Summer Student project. Fatima Kajout. 11 th of August 2003. Student Session 2003. The CMS Tracker: Front End Control and Monitoring. Front End Readout, Control and Monitoring Units.

E N D
CMS Tracker:Detector Control Units &Tracker Monitoring (A contribution to:) My Summer Student project Fatima Kajout 11th of August 2003 Student Session 2003
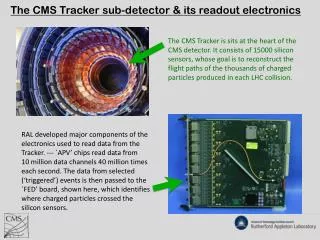
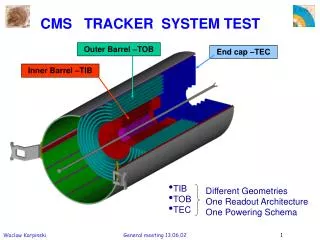
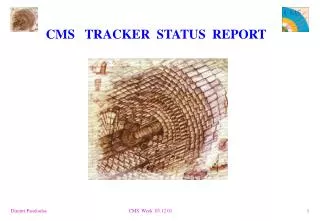
The CMS Tracker: Front End Control and Monitoring Front End Readout, Control and Monitoring Units Silicon detectors ~10 000000 detectors strips => A lot of temperature monitoring to do! Student Session 2003
DCU Detector Control Unit • Measures and monitors slowly varying analogue signals; i.e.: Temperatures, low voltages, detector currents,… • 2*2mm2 chip; power consumption 50mW • Contains an 8-channel, 12 bit ADC,… • Provides 2 bias currents for powering temperature probes • Will be mounted on every module hybrid where it will monitor: - Internal temperature probes, externaltemperature probes, voltages and currents. Student Session 2003
Hardware and Objectives Software and Objectives (1) Software and Objectives (2) Architecture Validation Conclusions Agenda Project Outline Student Session 2003
Project Outline • The project aimed to build the tools needed to collect DCU data, store them into a permanent database, retrieve all or part of the data, and finally display and analyze them. An evaluation of the temperature and voltage measurement spread was also made. • A prototype system with 12 DCU ASICs has been installed and used for tests. • Software technologies used are: Java, C++, SQL, mySQL and PAW. Student Session 2003
Hardware and Objectives • Prototype tests: no system of such size (“of the CMS Tracker”) can be assembled without exhaustive prototype work, followed by scalability studies that should validate the proposed architecture even when the number of modules grows by orders of magnitude, as in our case. I have set up a system with 12 DCU chips as a starting point. Performance measurements are foreseen. Student Session 2003
Measurements and calibration of 12 DCUs We used a set of 8 very-well measured resistors which simulated one thermistor at different temperatures (from –40 to 30 0C). DCUcts Calibration linear formula: Rin = offset + scale*DCUcts Rin Steinhart-Hart equation: 1/T = a*ln(Rin)³ +b*ln(Rin)² + c*ln(Rin) +d Temperature
Converting from DCU counts to Ohm • The present plots show the offset distribution and the scale factor distribution for the 12 DCU under test. The formula used is, of course, Counts = Offset + Scale * Resist • Clearly, there is a non-negligible spread in the offset values. It is still to be seen whether this influences the temperature measurement to the point of requiring a set of separate calibration constants for each DCU. • Although the spread is smaller, a non- uniformity in this calibration constant is as dangerous as one in the offset. At –30 and +300C, the RMS is ~ 1.2% of the mean value, i.e. for the same resistance value the measurements would vary ~ 1.2% (which is ~.5 0C at +300C and less at lower temperatures.)
Test temperature distribution • This plot shows, for all 12 DCU chips tested, the reconstructed temperature for the 8 resistors used to simulate thermistors. It is clear from this plot that with increasing temperatures the measurements become less accurate. This is due to the non-linearity of the thermistor characteristic: the higher the temperature, the less the value of the resistance changes for an equal temperature step. • Note that we will operate the CMS Tracker at –20° C => nice!!! Student Session 2003
Software and Objectives (1) • Database design: a proper definition of the tables and their relationships is mandatory in a project of this size. Therefore, I have studied the problem and derived tables in the third normal form, as recommended by IT literature. Student Session 2003
Database design 1 1 N N 1 ref ref 1 Value 1 1 Location Id Timestamp Sensor Id Measurement • Each measuremententity comprises: • a Value(an integer number produced by the analogue to digital conversion process); • a Timestamp (an integer number encoding the date and time at which the measurement was taken); • a Sensor Id (a reference to a Sensor entity in a separate table); • a Location Id (a reference to a Location entity in a separate table); Student Session 2003
Sensor-Type Table Thermistor 1 Thermistor 2 Voltage 1 Current 1 Description a=0.005;b=0.002;c=0.014;d=0.014 Algorithm Steinhart-hart equation Software and Objectives (2) • Interface design: in order to be of any use, a database system must offer interfaces that are easy to use and effective. Given the present database structure, the very first interface needed will be the one that allows to read the list of existing sensors and add to it. • We can: • Consult Student Session 2003
Architecture Validation • The DCU prototype system will be also used to validate the proposed general scheme for the monitoring of Tracker environmental parameters. In particular, one should establish whether individual DCU chips need calibration constants, or a single set can be used without excessive loss of accuracy. Student Session 2003
Conclusions What we wanted to do: • Gather DCU DATA and • Store • Retrieve • Display • Analyze How we accomplished it: • Prototyping a system with 12 DCUs and • Performed measurements and calibration (used predevelopped software for the CMS Trackers) • Designed a new, improved database • Designed a graphical interface Next steps: • Performance evaluation • Architecture validation • Finalize database Student Session 2003
Thank you! Any question? Student Session 2003