Download
1 / 43
430 likes | 592 Views
The CMS Strip Tracker detector: status and operations. VERTEX2011 workshop 19-24/06/2011. Lino Demaria - Torino INFN . Outline of the talk. CMS and the S(ilicon ) S(trip ) T(racker ) Services Status of the detector Commissioning of SST Performances studies. CMS Tracker .

E N D
The CMS Strip Trackerdetector: status and operations VERTEX2011 workshop 19-24/06/2011 Lino Demaria -Torino INFN
Outline of the talk • CMS and the S(ilicon) S(trip) T(racker) • Services • Status of the detector • Commissioning of SST • Performances studies
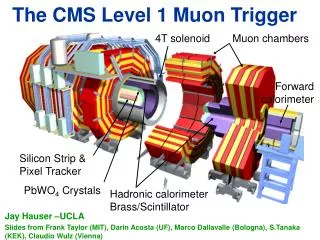
CMS Tracker • Main tracking detector • dp/p=10% for 1 TeV particle (with muondet) • High efficiency • good 2 track separation • Radiation hardness • As Light as possible L=5.4m F=2.4m Biggest Silicon Tracker ever build: all made in Silicon detectors: Pixel + Silicon microStrip Tracker
Silicon Strip Tracker • Modules: • 3112 + 3024 Thin modules (ss +ds) • 5496 + 3600 Thick modules (ss +ds) • Silicon: • 6,136 Thin sensors = 48m2 • 18,192 Thick sensors = 162m2 • 210 m2 of silicon microstrip sensors • FE Electronics: • 75,376 APV chips • 9,648,128 strips electr. Channels Tracker Inner Barrel (TIB ):4 layers: 2 Rf (2D), 2 Rf-Stereo (3D) Tracker Outer Barrel (TOB): 6 layers, : 4 Rf (2D), 2 Rf-Stereo (3D) Tracker Inner Disks (TID ):3*2 disks, : 1 Rz (2D), 2 Rz-Stereo(3D) Tracker EndCap (TEC): 9*2 disks, : 4 Rz (2D), 3 Rz-Stereo(3D) Each Track has at least 10 high precision measurements for Pt and 4 in Q Coverage: | h | < 2.5
Modules and Sensors • Silicon Microstrip Detector • p+ n detectors, • 6” technology, <100> orientation • AC coupled, R-poly biased, • w/p=0.25, 4-8 mm metal overhang, • Vbreak>500V • Thin sensors:300 mm, r = 1.5-3 kWcm • Thick sensors:500 mm, r = 3.5-7 kWcm • Different geometries and strip length. • Capacitance at preamplifier ~ 1.2 pf/cm
APV25 chip • Front end chip preamplifier: • 0.25 mm technology , rad-hard tested • 128 channels, mux at 20 MHz • 50 ns shaping time, 192 analog cell pipe line • Can run in two modes: • PEAK mode: normal CR-RC (50ns) • slow, lower noise • DECONVOLUTION: takes 3 consecutive sampling and applying deconvolution algorithm • faster signal, higher noise
Electronics chain FED digitize, apply CM rejection, makes Zero Suppression. Relies on the upload of good Pedestal and noise values Signal route ( analog ): • Module • Silicon • APV • MUX • AOH (electric to light) • fiber(length =O(50m)) . • FED channel 440 FEDs • Clock/Trigger/I2C (Control Rings) • FEC • Fiber • . • DOH ->CCU rings • CCU • Clock/Triggert: • PLL • APV • I2C to: • APV • PLL • MUX • DCU
Brief SST History • 2004-2006 • Pre-series, module/mechanics constructions, sub-assembly, back-end / services construction, general QA • Test of 2% of Tracker in the CMS Magnet Test Cosmic Challenge(MTCC) • 2007 • Assembly at CERN • commissioning and test with cosmic ray of 25% before insertion at T=15C, 10C, 0C, -10C • insertion in CMS • 2008 • Placement of services and connections at P5 • Commissioning at T=18C • CMS cosmics data taking at T=18C • 2009 • Commissioning at 4C • CMS cosmics data taking at T=4C • First collisions data (most in peak mode, 50 ns integration time) • 2010 • Commissioning in deconvolution mode • Collisions in deconvolution • 2011 • Collisions @ L~1033cm-2Hz
TEC TIB 2007 2007
Cooling • It is a double stage cooling: main chiller is serving several cooling plants of which the two biggest ones are serving the Strip Tracker • Main chiller was originally a Brine circuit, on 2007 was changed to C6F14 • Has to take 60 kW power from the Tracker. Liquid: C6F14, very volatile and neutral to electronics • 2 independent system, each with 90 lines each • Liquid at 4C temperature • System running stably: stable Low Leak rate achieved: SS1~0; SS2~0.5 kg/d (5 lines closed, out of 90) • Improvement in 2011: • pressure to the detector reduced for unchanged module’s temperature (0.6-0.8 Bar reduction) • CP pressure reduced from 9 to 7Bar and safety pressure switches were installed • Pump running with Variable Frequency Driver: longer lifetime, smoother operation, no pressure glitches, vibrations (pump were replaced due to overheat) • Bigger bypass valve installation to allow a smoother operation
Struggling with Leak Rate Lines 26 and 44 LOCKED Leaky valve (filter case) in the cooling plant Line 23: TIB 2.3.6 Line 25: TIB 2.3.1 Line 26: TIB 1.3.6 Line 30: TID 2.4 Line 44: TOB 1.3.1 Technical stop Winter Shutdown Line 30 OFF Leak search campaigns October NOW: 0,5kg/d August/september Line 23 LOCKED sincebeginning line 25 LOCKED since Sept-2009 July Line 30 LOCKED April Winter 10/11 March Winter 09/10 May Task force mandate Note: Over the sameperiod, SS1 wasleakingconstantlybelow0.1kg/d
Power Supply system Mainframe at Service Cavern • Floating Power supplies. • Located inside experimental cavern, in crates • powered via AC/DC converter. • Rad.Hard and B-field resistant • Power to modules • 1000 power supply modules (PSM). • each PSM hosts 2 units (PSU) each connected via a 30-50m cable to a part of the SST and providing • 1 PSU = 1 LV (1.25V, 2.5V) and 2 HV lines for detector modules. 1944 PSU used. • Power to Control Rings: • 356 control power supply 2.5V Racks @ Exp. Cavern Reached a Failure rate of 1% per year (2PSU/month) during 2010. During 2011 system is even more stable, below 1% All failures have a negligible impact on hit efficiency and no effect on tracking efficiency. Only Power groups failed (there are 2000 of them)
DAQ The Strip Tracker is by far the largest fraction of CMS to be readout, it consist of 440 FED, to be compared with less than 200 for the rest of CMS. System is very stable Down-time are caused in general to single FEDs stopping the DAQ. Several sources have been found and being addressed. • Occasionally spurious data are seen at the input of single FED and generate fake extra events, spoiling the synchronization with other DAQ. A FED firmware was implemented: it signal a state of Out-of-Sync at which DAQ reply with a resync command: FED cleans up the bad data and data taking can restart quickly; • Level of CRC error is small and negligible (was fixed during 2010) Slow control data are readout via DCU CCU DOH FEC. At module level they provide monitoring of: low voltages levels, silicon leakage current, hybrid and sensor temperatures. These are important ingredients to understand detector instabilities, working conditions, radiation damage: • the readout efficiency of DCU full chain has been greatly improved this year • some rings of CCU stop to work after some time: a recovery procedure is underdevelopment with a on-the-flight reset of the DCU
Alive channels: 97.75% • TIB 94.3% • TID 98.1% • TOB 98.2% • TEC 98.9% • Details: • 2 CR in short (~0.7%) • 1 CR missing (0.35%) • HV lines missing(0.1%) • HV lines shorts (0.7%) • fibers/CCU /others (0.4%) • Recoverable at LS1: • 2-3 CR corresponding to 0.7-1% Short in CR: 0.35% Recoverable at LS1 work@Patch panel Short in CR: 0.35% Recoverable at LS1 Work@Patch panel HV shorts Lost CR: 0.35%
Dead channels evolution:<SST> =1.5 2.2% Lost 1 CR 1 CR short HV shorts % of dead channels HV open <SST> = 1.5 2.2% CR shorts
Channels excluded from DAQ: time evolution <SST> =1.5 2.2% 2 TIB Cooling Loop closed 1 TID Cooling Loop recommissioned 1 TID Cooling Loop closed Closed CL recommisioned % of dead channels Lost 1 CR 1 CR short HV shorts HV open+ 1 CL closed <SST> = 1.5 2.2% CR shorts We were able to promptly recover modules associated with closed cooling loops They were recovered before physics data taking, both during 2010 and 2011
Always ready for collisions: • 2011 Up-time : 98.6% (98.8% on 2010) • Live time ~ 99.9% • SST HV-on >99% when regular fill of collision time: • HV turned on@stable beam with validation of good beam background • Turn on take 70 sec • HV turned off@handshake for Beam Dump (or adjust). Now HV turned down with with 3’ delay (LHC dump 5’ after handshake) • Work on-going to further increase the % of HV on Validation and turn-on~3’
HV on No beam in LHC: ramp down, setup,nobeam (light green) Stable beam (dark green) Beam preparation: injection, ramp-up,flat top,…), (yellow) Physics Cosmics Interfill periods are used to collect cosmics ray, important for weak modes in alignment
Operation in Heavy Ion • Occupancy during Heavy Ion collisions is very high. The zero suppressed algorithm implemented on FEDs is optimized for pp collision and the baseline needs optimization for HI data: it was decided to take data non-zero suppressed (200 kBytes/evt23 Mbytes/evt) • ok for FED up to several kHz • Optimization from central DAQ was needed in order to process and digest the amount of data • Detector up-time of 99.7% • The averagetrackeroccupancy for the barrel wasmeasured to be up to 8 % in minumumbias and up to 18 % for 0‐10% central collisions. • The comparisonbetween the FED ZS and the new ZS schemashowed a trackingefficiencyincrease of 2% for MB events. • Good input for a specialized FED firmware for Heavy Ion collisions
Operation temperature • Present temperature of coolant is 4C, no need so far to go colder • Original requirement for cooling system was to be able to achieve coolant temperature of -30C • For high irradiation is important to stay below 0C on silicon sensors; at -10C towards the end of the high luminosity period (TDR). • Strip Tracker baseline for 2011 and 2012 is to stay at coolant temperature of 4C • no problems foreseen wrt radiation damage • The long shutdown (LS1) will be used to make all needed interventions to go to as cold as needed in the high luminosity phase • We might use bigger heat exchanger (chiller/cooling plant) • We need tolower the dew point in the region just outside the strip tracker volume with a better sealing there • We are working now to define at best the intervention for LS1 • Cold temperature test of cooling plant • Defining cooling efficiency for all strip tracker modules
Silicon Detector temperatures Closed CL: 3 TIB L3 CL 1 TOB L4 CL 1 TID R1-R2 CL
Effect of leakage current from irradiation Radiation induced leakage current started to be visible on silicon sensors. Clear linear dependence is seen wrt integrated luminosity Table with Ileak of single HV lines in different Layer, at the present Temperature. Ileak expressed in mA/fb-1 (slope) Normalization of current to the silicon volume and sensor temperature allows to determine the distribution of the radiation dose in the strip tracker: first preliminary analyses indicate that radial dependency and absolute values are compatible with simulation models expectations More on F.Hartmann’s talk at this conference
Commissioning Steps Internal synch Gain Calibr Base line adjust • Internal synchronization • Gain calibration • Base line adjustment • Pulse shape adjustment • Pedestal and noise measurement • Synchronization with particles Pulse shape tuning Pedestal and noise Latency scan (peak)
Time synchronizationwith collisions All layers but that under measurement are in peak mode and act as telescope for the layer under measurement The layer under measurement is put in deconvolution mode and the charge of the hit associated to the track is searched. The timing of this layer is scanned in steps of 2ns from -25 ns to 25 ns One layer per sub-detector. The delay setting are then uploaded correcting for the time of flight according to the module position. Deconvolution readout
Signal time profile Time profile of the signal in different parts of the siliconstriptracker. Obtained in dedicated short runwithrandomized timing. Profile show the expectedwidth of 12ns. This measurementcanbeperformedwithout impact on tracking performances • Measured position of signal maximum wrt • the nominal sampling point • Deviation in within ~1ns. Impact on signal amplitude is ~1%
HV Scan The HV of all the strip modules is scanned. Fitting the signal over the nominal noise the depletion voltage is measured. This measurement is done twice per year More on Frank Hartman’s talk during this conference
S/N performance: deconvolution Deconvolution mode is the default for collisions. Results agrees with expectations
S/N module per module S/N~20 for thin silicon (300 mm); S/N~30 for thick silicon (500 mm)
Hit Efficiency Given a good track crossing a layer the presence of a hit in that layer measures its hit efficiency. Cuts are applied, avoiding tracks crossing a layer at the border of the acceptance region, given the extrapolation error of the track Results are shown included ANY module in the readout (black square) and selecting only modules known to be good.
Lorentz angle The hole charge drifting to the strips is displaced by the magnetic field by (Lorentz force). The Lorentz angle is measured plotting cluster width vs. the tangent of the track angle: it is minimum identify the Lorentz angle TIB : tan(θL) = 0.07 ± 0.02 TOB: tan(θL) = 0.09 ± 0.01
Hit Resolutions Detector hit resolutions are measured using module overlaps. Results are shown here for track angles between 0 and 10 degrees Resolutions are below the binary resolution. Pitch=80 for TIB L1, L2 Pitch=122 for TIB L3,L4 TOB L5, L6 Pitch=183 for TOB L1, L2, L3, L4
dE/dx vs. momentum • The dE/dx measurement of a track is obtained from all values of the hits (~10 points). • Kaons, protons, deuterons and tritium are visible. • Redlines are Bethe-Bloch expectations extrapolatedfrom a fit of the proton line. • Small deviationat large dE/dxfrom saturation.
Conclusions (1) • The Strip Tracker is the main tracking detector of CMS • Detector has maintained excellent operational performance during the 2011 data taking period. The increase of instantaneous luminosity up to 1033 cm-2s-1 did not introduced any new issues for the detector • high quality physics data were collected with an uptime above 98.5%. • Sources of downtime have been identified and problems were properly addressed • Services and infrastructures are reliable and stable
Conclusions (2) • Detector Performance is excellent: • S/N>18 in deconvolution (with BX identification) • >99.8% hit efficiency • Resolution of 20 micron for smaller pitches • dE/dx measurements show kaons, protons and deuterons • First effects on radiation damage of silicon sensors give indication to follow expectations • Detector is well in shape and ready to continue collecting excellent data for the whole 2011-2012 period
Hybrid temperatures Closed CL: 3 TIB L3 CL 1 TOB L4 CL 1 TID R1-R2 CL
S/N performance: Peak MPV 26.7 MPV 28.8 MPV 35.7 Peak mode used during cosmic ray and in 2009 collisions. Results agrees with expectations MPV 27.4 MPV 34.1