Download
1 / 1
10 likes | 134 Views
RELIABILITY ASSESSMENT OF ROOF SHEATHING PERFORMANCE. IN LIGHT WOOD FRAME STRUCTURES SUBJECTED TO WIND PRESSURE. Maral Amini. Department of Civil Engineering The Pennsylvania State University. CERS 2010. Wind. MOTIVATION. STOCHASTIC MODEL.

E N D
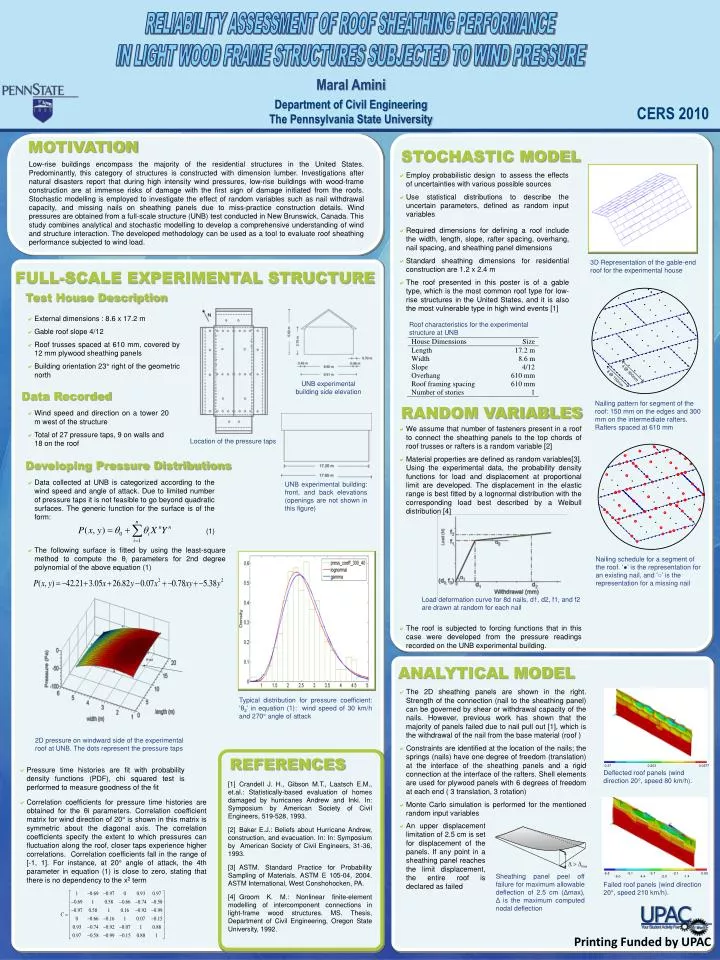
RELIABILITY ASSESSMENT OF ROOF SHEATHING PERFORMANCE IN LIGHT WOOD FRAME STRUCTURES SUBJECTED TO WIND PRESSURE Maral Amini Department of Civil Engineering The Pennsylvania State University CERS 2010 Wind MOTIVATION STOCHASTIC MODEL Low-rise buildings encompass the majority of the residential structures in the United States. Predominantly, this category of structures is constructed with dimension lumber. Investigations after natural disasters report that during high intensity wind pressures, low-rise buildings with wood-frame construction are at immense risks of damage with the first sign of damage initiated from the roofs. Stochastic modelling is employed to investigate the effect of random variables such as nail withdrawal capacity, and missing nails on sheathing panels due to miss-practice construction details. Wind pressures are obtained from a full-scale structure (UNB) test conducted in New Brunswick, Canada. This study combines analytical and stochastic modelling to develop a comprehensive understanding of wind and structure interaction. The developed methodology can be used as a tool to evaluate roof sheathing performance subjected to wind load. • Employ probabilistic design to assess the effects of uncertainties with various possible sources • Use statistical distributions to describe the uncertain parameters, defined as random input variables -0.37 0.203 0.0277 • Required dimensions for defining a roof include the width, length, slope, rafter spacing, overhang, nail spacing, and sheathing panel dimensions • Standard sheathing dimensions for residential construction are 1.2 x 2.4 m • The roof presented in this poster is of a gable type, which is the most common roof type for low-rise structures in the United States, and it is also the most vulnerable type in high wind events [1] 3D Representation of the gable-end roof for the experimental house FULL-SCALE EXPERIMENTAL STRUCTURE Test House Description • External dimensions : 8.6 x 17.2 m • Gable roof slope 4/12 • Roof trusses spaced at 610 mm, covered by 12 mm plywood sheathing panels • Building orientation 23° right of the geometric north Roof characteristics for the experimental structure at UNB UNB experimental building side elevation Data Recorded -6.8 -5.1 -3.7 -2.1 -0.63 -6.0 -4.4 -2.8 -1.4 Nailing pattern for segment of the roof: 150 mm on the edges and 300 mm on the intermediate rafters. Rafters spaced at 610 mm RANDOM VARIABLES • Wind speed and direction on a tower 20 m west of the structure • Total of 27 pressure taps, 9 on walls and 18 on the roof • We assume that number of fasteners present in a roof to connect the sheathing panels to the top chords of roof trusses or rafters is a random variable [2] • Material properties are defined as random variables[3]. Using the experimental data, the probability density functions for load and displacement at proportional limit are developed. The displacement in the elastic range is best fitted by a lognormal distribution with the corresponding load best described by a Weibull distribution[4] • The roof is subjected to forcing functions that in this case were developed from the pressure readings recorded on the UNB experimental building. Location of the pressure taps Developing Pressure Distributions • Data collected at UNB is categorized according to the wind speed and angle of attack. Due to limited number of pressure taps it is not feasible to go beyond quadratic surfaces. The generic function for the surface is of the form: UNB experimental building: front, and back elevations (openings are not shown in this figure) (1) • The following surface is fitted by using the least-square method to compute the θi parameters for 2nd degree polynomial of the above equation (1) Nailing schedule for a segment of the roof. ‘●’ is the representation for an existing nail, and ‘○’ is the representation for a missing nail Load deformation curve for 8d nails, d1, d2, f1, and f2 are drawn at random for each nail ANALYTICAL MODEL • The 2D sheathing panels are shown in the right. Strength of the connection (nail to the sheathing panel) can be governed by shear or withdrawal capacity of the nails. However, previous work has shown that the majority of panels failed due to nail pull out [1], which is the withdrawal of the nail from the base material (roof ) • Constraints are identified at the location of the nails; the springs (nails) have one degree of freedom (translation) at the interface of the sheathing panels and a rigid connection at the interface of the rafters. Shell elements are used for plywood panels with 6 degrees of freedom at each end ( 3 translation, 3 rotation) • Monte Carlo simulation is performed for the mentioned random input variables Typical distribution for pressure coefficient: ‘θ2’ in equation (1): wind speed of 30 km/h and 270°angle of attack 2D pressure on windward side of the experimental roof at UNB. The dots represent the pressure taps REFERENCES • Pressure time histories are fit with probability density functions (PDF), chi squared test is performed to measure goodness of the fit Deflected roof panels (wind direction 20°, speed 80 km/h). [1] Crandell J. H., Gibson M.T., Laatsch E.M., et.al.: Statistically-based evaluation of homes damaged by hurricanes Andrew and Inki. In: Symposium by American Society of Civil Engineers, 519-528, 1993. [2] Baker E.J.: Beliefs about Hurricane Andrew, construction, and evacuation. In: In: Symposium by American Society of Civil Engineers, 31-36, 1993. [3] ASTM. Standard Practice for Probability Sampling of Materials. ASTM E 105-04, 2004. ASTM International, West Conshohocken, PA. [4] Groom K. M.: Nonlinear finite-element modelling of intercomponent connections in light-frame wood structures. MS. Thesis, Department of Civil Engineering, Oregon State University, 1992. • Correlation coefficients for pressure time histories are obtained for the θi parameters. Correlation coefficient matrix for wind direction of 20° is shown in this matrix is symmetric about the diagonal axis. The correlation coefficients specify the extent to which pressures can fluctuation along the roof, closer taps experience higher correlations. Correlation coefficients fall in the range of [-1, 1]. For instance, at 20° angle of attack, the 4th parameter in equation (1) is close to zero, stating that there is no dependency to the x2 term • An upper displacement limitation of 2.5 cm is set for displacement of the panels.If any point in a sheathing panel reaches the limit displacement, the entire roof is declared as failed Sheathing panel peel off failure for maximum allowable deflection of 2.5 cm (Δmax), Δ is the maximum computed nodal deflection Failed roof panels (wind direction 20°, speed 210 km/h). Printing Funded by UPAC