Download
1 / 36
380 likes | 422 Views
Thermal Methods of Analysis. Calorie-something we know. What is calorie? Can you see or touch a calorie? How is it measured? Working out in gym Change in weight Loss of calories-burning of fat? (10 km=500calories/9cal per g=55 grams or 0.1 lb) Loss of weight -water

E N D
Calorie-something we know • What is calorie? • Can you see or touch a calorie? • How is it measured? • Working out in gym • Change in weight • Loss of calories-burning of fat? (10 km=500calories/9cal per g=55 grams or 0.1 lb) • Loss of weight -water • Physical instruments • Bomb calorimetry
Thermal Analysis • Thermal analysis is a branch of materials science where the properties of materials are studied as they change with temperature.
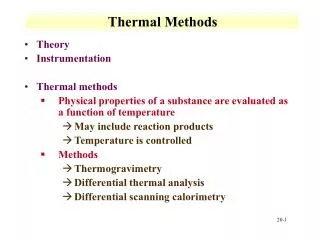
Thermogravimetry (TG): recording of sample weight changes during controlled temperature programs (dynamical or isothermal) Differential thermoanalysis (DTA): recording of temperature difference between sample and reference crucible during controlled temperature programs. Reaction or phase transition enthalpy can be calculated. Differential scanning calorimetry (DSC): power compensated DSC: sample and reference are kept at the same temperature, the difference in the necessary heating power(energy) is recorded. heat flux DSC: measurement of temperature difference between sample and reference similar to DTA, but with higher sensitivity Thermoanalytical Methods
Thermogravimetry Analysis (TGA) The mass of a sample is measured as a function of the time and temperature. A highly sensitive balance monitors the weight loss of a sample (verses time and temperature) Heat flow can be measured to determine if a reaction is endothermic or exothermic
TGA-GC-MS Gases produced can be separated on GC and analysed by IR or MS GC-MS TGA
Thermal Analysis •TGA can provide information about physical phenomena like vaporization, sublimation, absorption, and desorption. •Also chemical phenomena including dehydration, decomposition and oxidation and reduction reactions.
Mass Change of Teflon with Temperature Thermogram
Teflon Fluorine Polytetrafluorethylene
Calcium oxalate monohydrate (12.51 mg) H2O, (11.68%, 1.46 mg) CO (18.32%,2.92 mg) CO2 (39.75%,3.85 mg) TGA thermogram Weight decreases as lose H2O, CO and CO2
Thermogravimetry (TGA) Instrumentation Main components: • Sensitive analytical balance • Furnace • Temperature programming unit • Recorder • Sample holder (thermally isolated)
Thermogravimetry Analyser Microgram Balance Sample crucible Temperature programable furnace
Differential Thermal Analysis (DTA) • DTA involves heating or cooling a test sample and an inert reference under identical conditions, while recording any temperature difference between the sample and reference. 2. This differential temperature is then plotted against time, or against temperature. Changes in the sample which lead to the absorption or evolution of heat can be detected relative to the inert reference. 3. DTA can therefore be used to study thermal properties and phase changes.
Differential Thermal Analysis Heat absorbed Heat loss area Hear Absorbed Thermogram
Differential Thermal Analysis • A DTA consists of a sample holder comprising thermocouples, sample containers and a ceramic or metallic block; a furnace; a temperature programmer; and a recording system. • The key feature is the existence of two thermocouples connected to a voltmeter. One thermocouple is placed in an inert material such as Al2O3, while the other is placed in a sample of the material under study.
Differential Thermal Analysis The amount of heat involved and temperature at which these changes take place are characteristic of individual elements or compounds. Identification of a substance is accomplished by comparing DTA curves obtained from the unknown with those of known elements or compounds. The amount of a substance present in a composite sample is related to the area under the peaks in the graph compared to standards.
Differential Thermal Analysis Heat absorbed Heat loss area Hear Absorbed Thermogram
Aspects of a differential thermogram Summary Minima: sample becomes cooler than reference because reactions are endothermic. Maxima: sample becomes warmer than reference, reaction is exothermic. The area under the curve is relative to concentration of sample Thermic processes include: fusion, vaporization, sublimation, desorption, some chemical reactions.
TGA-DTA TGA DTA
Differential Scanning Calorimetry (DSC) • DSC analysis operates by determining how much energy is required to heat a pan containing a sample compared to an empty reference pan. • If the sample undergoes an endothermic (absorbs heat) or exothermic (gives off heat) reaction, the sample pan will require more or less energy to increase the temperature at the same rate as the reference pan. • By measuring the difference between the energy applied to each heater as the temperature is increased, the energy consumed or released by the sample can be determined.
Differential Scanning Calorimeter Reference Sample Thermocouple Heater Control Detector Two separate furnaces
Differential Scanning Calorimetry (DSC) • DSC can determine phase transitions of materials. These phase transitions include: • Melting Point (Tm) • Glass Transition Temperature (Tg) • Energy Absorbed (Hm) while melting • Crystallization Point (Tc) • Energy Released (Hc) during crystallization
∆H(enthalpy) = K (constant)A(area) Crystalization (exothermic) Heat flow Glass transition Melting (endothermic) Temperature
Thermogram obtained by DSC Minima (negative peaks): system cools down, must be given heat to keep same temperature as reference. Maxima (positive peaks): system warms up, reference must be given heat to keep up with sample. Endothermic processes: fusion, vaporization, sublimation, desorption, some chemical reactions.
Two types of methods used in DSC: • Power-compensated DSC • Sample and reference temperatures are kept equal • byheating with separate heaters while external • heat is increased or decreased linearly. • ii)Heat flux DSC • Difference in heat flux into the reference and sample is • measured as sample T is increased or decreased linearly.
Power-compensated DSC - Two independent furnaces - Furnaces are small, allow about 1 g of sample, for rapid heating, cooling and equilibration. - Furnaces are embedded in a large heat sink - Sample and reference holders are equipped with Pt resistance thermometers to continuously monitor temperature (T) values. Two control circuits, one for average T control, the other for differential T control.
Heat flux DSC - Heat flows in the sample and reference - A thermoelectric disc is used for this purpose - Sample and reference cups (Al) are placed on elevated platforms on disc - Differential heat flow is monitored by chromel thermocouples - Differential heat flow directly proportional to output - Difference between both thermocouple junctions
Simultaneous TGA-DSC • Simultaneous TGA-DTA/DSC measures both heat flow and weight changes (TGA) in a material as a function of temperature or time in a controlled atmosphere. • Simultaneous measurement of these two material properties not only improves productivity but also simplifies interpretation of the results. • The complementary information obtained allows differentiation between endothermic and exothermic events with no associated weight loss (e.g., melting and crystallization) and those that involve a weight loss (e.g., degradation).
Netzsch Simultaneous Thermal Analyzer (STA) Incorporates TGA and DSC to measure mass change and heat flow rate simultaneously.
GTA DSC
Most important application areas: • Compositional analysis • Thermal and oxidativestability • Product lifetime • Filler content of materials • Moisture and volatile content • Effects of reactive atmospheres on materials • Decomposition kinetics