Download
1 / 47
490 likes | 647 Views
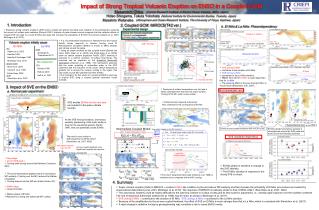
Atmospheric Impact of the 1783-1784 Laki volcanic eruption. David Stevenson (University of Edinburgh) Thanks to: Ellie Highwood (Univ. Reading), Colin Johnson, Bill Collins, Dick Derwent (Met Office) Funding:. Talk Structure. Motivations: volcanoes and the atmosphere Introduce:

E N D
Atmospheric Impact of the 1783-1784 Laki volcanic eruption David Stevenson (University of Edinburgh) Thanks to: Ellie Highwood (Univ. Reading), Colin Johnson, Bill Collins, Dick Derwent (Met Office) Funding:
Talk Structure • Motivations: volcanoes and the atmosphere • Introduce: • The Laki eruption • Atmospheric chemistry model • Tropospheric sulphur cycle • Model experiments & results • Radiative forcing & climate impact • Conclusions / problems
Solar radiation Aerosol reflects Solar radiation – net cooling SO2 oxidises to H2SO4 aerosol: Residence time ~year (mid-stratosphere) weeks-months (UT/LS) days-weeks (troposphere) Ash falls out quickly (hours-days)
Pinatubo aerosol from the Space Shuttle Aerosol layer ~20-25 km Tropopause ~15 km SO2(gas) + OH → H2SO4(aerosol)
IPCC 2001 Volcanoes and Climate • Natural climate variability • How much of this is due to volcanoes?
Hansen et al. 1997 IPCC, 2001 GISS GCM Volcanoes and Climate • Test climate model sensitivity/response
Volcanoes and Climate • Focus to date on large explosive eruptions, or those that leave a record in the Greenland or Antarctic ice. • What about large effusive eruptions?
‘Fires of the Earth – The Laki Eruption 1783-1784’ Eyewitness account of the eruption by the local vicar(Rev. Jon Steingrimsson) Recently reprinted by the University of Iceland, and translated into English 1/5 of Iceland’s population died (10,000 people) Much better than that cack by Tolkien
27 km long fissure 580 km2 of lava
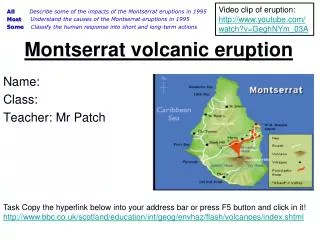
1783-84 Laki eruption, Iceland • 8 June 1783: 27 km long fissure opens • 15 km3 of basalt erupted in 8 months • 60 Tg(S) released • 60% in first 6 weeks • Fire-fountaining up to ~800 - 1450 m • Eruption columns up to ~6 - 13 km • Tropopause at ~10 km • ‘Dry fog’ or ‘blue haze’ recorded over Europe, Asia, N. Atlantic, Arctic, N. America • This appears to have been a sulphuric acid aerosol layer in the troposphere and/or lower stratosphere
~200m Fire-fountaining at Etna, 2002 Photos from Tom Pfeiffer’s web-site: www.decadevolcano.net
Environmental impacts • 20% of the Icelandic population die • Acid deposition destroys crops & grazing • Similar impacts across Europe • Cooling of NH (regionally extreme, e.g. Alaska) • Cooling for several years (Franklin, 1785) • Famine
Questions • Using our best estimate of the Laki SO2 emissions, what is the modelled impact on the global atmospheric composition? • Does it agree with observations? • Can it generate a climate impact?
Atmospheric model: STOCHEM • Global 3-D chemistry-transport model • Meteorology: HadAM3 • GCM grid: 3.75° x 2.5° x 58 levels • CTM: 50,000 air parcels, 1 hour timestep • CTM output: 5° x 5° x 22 levels • Detailed tropospheric chemistry • CH4-CO-NOx-hydrocarbons • detailed oxidant chemistry • sulphur chemistry • Normally used for air quality/climate studies • This version has high resolution tropopause
Air parcel centres Eulerian grid from GCM provides meteorology Interpolate met. data for each air parcel STOCHEM framework
For each air parcel • Advection step • Interpolated winds, 4th order Runge-Kutta • Plus small random walk component (=diffusion) • Calculate emission and deposition fluxes • Prescribe gridded emissions for NOx, CO, SO2, etc. • Integrate chemistry • Photochemistry (sunlight, clouds, etc.) • Gas-phase chemistry (T, P, humidity, etc.) • Aqueous-phase chemistry (cloud water, solubility, etc.) • Mixing • With surrounding parcels • Convective mixing (using GCM convective clouds) • Boundary layer mixing
Oxidants normally determined by background photochemistry – but very high SO2 levels will deplete them +OH SO2 gas SO4 aerosol emissions +H2O2(aq) (in clouds) dry(wet) deposition wet(dry) deposition Sulphur chemistry +O3(aq) Only deposition rates determine the SO4 lifetime Oxidation and deposition rates determine the SO2 lifetime
Burden Tg(S) Lifetime Days Fluxes in Tg(S)/yr OH 6.3 0.29 SO2 SO4 0.81 1.1 5.3 H2O2 32 49 O3 17 30 9.2 7.1 9 12 71 DMS MSA 4 1.4 Deposition Deposition 15 Dry Wet Dry Wet 1 Biomass burning Anthro- pogenic Volcanic Soil Oceanic Present-day tropospheric sulphur cycle
Laki sulphur emissions • Analysis of the S-content of undegassed magma suggests ~60 Tg(S) released by Laki (Thordarson et al., 1996) • ~1990 global annual anthropogenic input • Compare to Pinatubo: ~20 Tg(S) • What was the vertical profile of emissions?
Laki value 61 Peak value ~2 Total 72 1990 Anthropogenic SO2 emissions (annual total) 0.1 1 10 100 Tg(S)/yr/5x5
Model experiments • 1990 atmosphere • Background ‘pre-industrial’ atmosphere • Two Laki emissions cases ‘lo’: emissions evenly distributed 0-9 km ‘hi’: 75% emissions at 8-12 km, 25% at 0-3 km • All runs had fixed (‘1996-97’) meteorology No attempt made to simulate 1783 weather • Run for one year following start of eruption • Generate aerosol distributions • No feedback between aerosols climate • Calculate radiative forcings and climate effects later
Laki Pre-industrial background Tropopause SO2 SO4 Zonal mean JJA SO2 & sulphate
July SO2 (ppbv) Laki hi Surface 0.5 km 550 hPa 5 km 0.1 0.2 0.5 1 2 5 10 20 50 100 0.1 0.2 0.5 1 2 5 10 20 50 100 350 hPa 8 km 200 hPa 12 km 0.1 0.2 0.5 1 2 5 10 20 50 100 0.1 0.2 0.5 1 2 5 10 20 50 100
100 100 100 100 1000 1000 1000 1000 50 50 50 50 200 200 200 200 500 500 500 500 2000 2000 2000 2000 5000 5000 5000 5000 July SO4 (pptv) Laki hi Surface 0.5 km 550 hPa 5 km 350 hPa 8 km 200 hPa 12 km
10 10 10 100 100 100 1000 1000 1000 20 20 20 50 50 50 200 200 200 500 500 500 2000 2000 2000 5000 5000 5000 Laki SO4 evolution Upper Trop Lower Strat Surface 90°N lo Eq 90°S May 1784 June 1783 SO4 / pptv 90°N hi Eq 90°S
+OH SO4 aerosol 16% +H2O2(aq) 16% +O3(aq) 4% 10% 90% 28% 37% Dry dep Wet dep Dry dep Wet dep Laki sulphur budget Hi case 22 Tg(S) or 89 Tg (H2SO4.2H2O) SO2 gas Emissions 61 Tg(S)
Impact on oxidants (JJA) H2O2 O3 OH
Laki Sulphate budget (JJA) LS tSO4 = 67 days (no transport: >7 yrs) UT tSO4 = 10 days (no transport: 32 days) LT tSO4 = 5.3 days
Greenland Ice-core data H2SO4 deposition rates mg(S)/m2/yr
Aerosol yield/peak loading Tg(H2SO4)
Radiative forcing & Climate impactEllie Highwood (Reading Univ) • Aerosol fields inserted into Reading IGCM • 3 experiments: • 1. Hi/long decay (10 month e-fold) • 2. Hi/short decay (3.6 month e-fold) • 3. Lo • Each has a 10 member ensemble of 3 yr runs • Compare to control run with no forcing • Only direct aerosol effect
Climate Impact lo hi
Climate impact • Hi runs have NH cooling of –0.21K, in good agreement with observations (-0.14 to –0.27K) • Lo runs show no significant cooling • BUT: runs neglect indirect aerosol effects • Hi runs also have cooling persisting for 3 years, due to feedbacks (ice/snow albedo)
Conclusions(1) • 1st attempt at chemistry-climate modelling of the Laki eruption • Simulated a sulphate aerosol cloud across much of the NH during the 8-month eruption • Deposition to Greenland similar to ice-core record • 60-70% of emitted SO2 is deposited before forming aerosol (previous studies assumed it all formed aerosol) • Mean lifetime ~week • Atmospheric loading less than previous estimates
Conclusions(2) • Oxidants H2O2 & OH strongly depleted • lengthens the SO2 lifetime • more likely to be deposited as SO2 • Climate modelling suggests Hi scenario gives ~0.2K cooling, and persists for >2 years; this matches observations • But: many processes missing • For more info: 2 papers in ACP: www.copernicus.org/EGU/acp • davids@met.ed.ac.uk
Problems(1) • Volcanology: • Emissions uncertain • Magnitude • Vertical profile • Temporal distribution – episodic • Plume processes, e.g. scavenging of SO2/SO4 by ash in the eruption column
Problems(2) • Chemistry modelling • Not fully coupled • No aerosol microphysics • No coupling of aerosol to photolysis rates • Only 1 heterogeneous reaction (N2O5 loss)
Problems(3) • Climate model • Simplified radiation scheme – more bands suggest forcing is smaller by factor 0.6 • Humidity assumptions – 80% RH increases forcing by factor 2.6 • No aerosol indirect effects • Climate sensitivity low compared to other models: suggests duration of forcing may be underestimated
2 Papers in Atmospheric Physics & Chemistry: www.copernicus.org/EGU/acp/acp/3/487/acp-3-487.pdf www.copernicus.org/EGU/acp/acp/3/1177/acp-3-1177.pdf