Download
1 / 31
310 likes | 433 Views
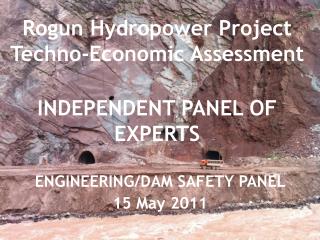
Techno-economic assessment of potential CCS deployment in the Southern African region. Bruno Merven , ERC in conjunction with VITO and the World Bank. The World Bank. Sandton , South Africa , 31st May 2011 World Bank CCS Capacity Building Trust Fund.

E N D
Techno-economic assessment of potential CCS deployment in the Southern African region Bruno Merven, ERC in conjunction with VITO and the World Bank The World Bank Sandton, South Africa, 31stMay 2011 World Bank CCS Capacity Building Trust Fund
Techno-economic assessment of potential CCS deployment in Southern African Region • World Bank project conducted by consortium of VITO (Belgium), EIHP (Croatia) and ERC (South Africa) • Overall objective: • Assess possible application and development of CCS in power systems in Balkan and Southern Africa regions using a techno-economic model Techno-economic assessment of CCS deployment in Southern Africa | Sandton| May 2011 | 2 World Bank CCS Capacity Building Trust Fund
Project Activities • Assessment of available underground storages and their economic characteristics • Development of a regional techno-economic model (interconnected power system) • Scenario based simulation and optimization • Workshop support and results presentation • Project report Techno-economic assessment of CCS deployment in Southern Africa | Sandton| May 2011 | 3 World Bank CCS Capacity Building Trust Fund
4 Countries: South Africa, Botswana, Mozambique and Namibia Population:74.5 million GDP (PPP): ~600billion (2000US$) Electricity demand – ~278 TWh growing by ~200 TWh by 2030 Total installed capacity (2009): ~47 GW thermal: 90% (Mainly coal) remainder Hydro Critical system reserve in several countries South Africa accounts for ~91% of total electricity demand Regional transmission network is sparsely connected with some new connection projects underway CO2emission from power sector – ~246Mton UNFCC/Kyoto: ratified by all countries in study. Only South Africahas a quantitative reduction target Study Area of Southern African Region Techno-economic assessment of CCS deployment in Southern Africa | Sandton| May 2011 | 4 World Bank CCS Capacity Building Trust Fund
Generation expansion options • Large coal resource available in all four countries • Natural gas:Namibia, Mozambique, South Africa (LNG/pipeline imports) • CBM Potential in Botswana • Nuclear program under consideration in South Africa • Large scale hydro in Namibia and Mozambique • Solar (all four countries), wind (SA, Namibia), biomass (SA, Mozambique) Techno-economic assessment of CCS deployment in Southern Africa | Sandton| May 2011 | 5 World Bank CCS Capacity Building Trust Fund
General modeling Assumptions • Model used MESSAGE (IIASA/IAEA) • Planning horizon: 2010-2030 • Demand Projection based on IRP (SA) and SAPP pool plan study • Real discount rate: 8% • All costs expressed in US$(level 2010 – 7.4 Rands to the US$) • Gradual decrease of electricity import to 15% of domestic energy needs by 2020 • RE limited to 30% in each country • Technology and Fuel Costs based on SA IRP 2011 (dry cooling for coal) • Technology learning applied to RE • CCS plant cost and efficiency calculated by scaling IRP costs and efficiency by increment in generic costs and efficiencies researched by Vito. • Coal plants with CCS cost about 50% more and are 7% less efficient • Retrofit costs given 40% premium above plant built with CCS first time. Techno-economic assessment of CCS deployment in Southern Africa | Sandton| May 2011 | 6 World Bank CCS Capacity Building Trust Fund
CCS transport and storage options Saline Aquifers Oil/Gas Fields Coal Fields • Transport Costs based on IPCC of $1/tonCO2/100km • Storage Costs around $10-$15 /tonCO2 Techno-economic assessment of CCS deployment in Southern Africa | Sandton| May 2011 | 7 World Bank CCS Capacity Building Trust Fund
Levelized Cost Curves for Electricity Techno-economic assessment of CCS deployment in Southern Africa | Sandton| May 2011 | 8 World Bank CCS Capacity Building Trust Fund
Levelized Cost Curves for Electricity • Breakdown of Coal CCS options • LCOE CCS options vs Coal and Nuclear • EOR benefit estimated by Vito at $40/tonCO2 and ECBM at $4.8/tonCO2 • Cross over for Coal-Nuclear: $25/ton • Cross over for Coal CCS Botswana and Coal: $40/ton • Nuclear always costs more than CCS with EOR and less than CCS with ECBM Techno-economic assessment of CCS deployment in Southern Africa | Sandton| May 2011 | 9 World Bank CCS Capacity Building Trust Fund
Cost Curve for CCS (SA) • Oil/gas fields in Mozambique/SA most cost effective CCS option but storage capacity limited (450 MW, 350 MW running 85% for 30 years) • Botswana coal fields capacity large but more expensive than nuclear (~17 GW) • Saline aquifer storage potential even larger but injectivity, capacity and costs uncertain • Nuclear Techno-economic assessment of CCS deployment in Southern Africa | Sandton| May 2011 | 10 World Bank CCS Capacity Building Trust Fund
Development scenarios • Reference scenario: least cost optimization • Baseline scenario: South Africa IRP “revised balanced” – with CO2 Limit on South Africa • Without EOR/ECBM benefits • With EOR/ECBM benefits • CO2tax scenarios (with EOR/ECBM benefits and CO2 limit for South Africa) • $25/ton CO2 • $50/ton CO2 • $100/ton CO2 (All scenarios have IRP committedbuild plan) Techno-economic assessment of CCS deployment in Southern Africa | Sandton| May 2011 | 11 World Bank CCS Capacity Building Trust Fund
Generation dominated by coal, with some hydro Diesel and Natural gas used for peaking CO2 emission Cumulative: 6,418 Mton 2030: 380 Mton Average generation cost hovers around 47$/MWh before increasing from 2022 onwards, reaching around 53 $/MWh in 2030. Reference (least cost) scenario Power Generation Emissions and Costs Techno-economic assessment of CCS deployment in Southern Africa | Sandton| May 2011 | 12 World Bank CCS Capacity Building Trust Fund
Baseline Scenario (IRP SA) Power Generation • Less coal and more RE and Nuclear to meet SA emissions target • Avg. costs rise to $67/MWh • Some Gas CCS plants near the depleted oil/gas fields, with cumulative stored reaching 25Mton CO2 Emissions and Costs Stored CO2 Techno-economic assessment of CCS deployment in Southern Africa | Sandton| May 2011 | 13 World Bank CCS Capacity Building Trust Fund
CCS coal option becomes competitive for South Africa Share of CCS based generation reaches10% in 2030 Avg costs rise to $77/MWh Depleted SA oil fields reach maximum potential by 2028. CO2 redirected to Mozambique $25/ton CO2Tax scenario Techno-economic assessment of CCS deployment in Southern Africa | Sandton| May 2011 | 14 World Bank CCS Capacity Building Trust Fund
CCS now is also competitive in Botswana and Namibia Share of CCS based generation reaches16% in 2030 Avg costs rise to $120/MWh Depleted SA oil fields reach maximum potential by 2026. SA CO2 redirected to Mozambique and Botswana $100/ton CO2Tax scenario Techno-economic assessment of CCS deployment in Southern Africa | Sandton| May 2011 | 15 World Bank CCS Capacity Building Trust Fund
Results Summary: Emissions and Costs • SA CO2 target in Baseline (IRP) drops regional emissions by 28% in 2030 (11% cumul.) relative to reference (least cost). • Further significant reductions only seen at $100/ton CO2 price. Techno-economic assessment of CCS deployment in Southern Africa | Sandton| May 2011 | 16 World Bank CCS Capacity Building Trust Fund
Results summary: Structure of Generation and Stored CO2 • Coal share does not change much between Base-line, $25 CO2 tax and $50 CO2 tax but drops when tax increased to $100/ton • In baseline contribution of CCS marginal mainly in terms of CCGT CCS • With a CO2 tax Coal CCS starts coming in Techno-economic assessment of CCS deployment in Southern Africa | Sandton| May 2011 | 17 World Bank CCS Capacity Building Trust Fund
ConclusionsProject activities realised • An analysis focusing on the use of CCS (Carbon Capture and Storage) technologies and their competitiveness with other options was carried out • Underground storage volume and associated transport and storage costs were researched and estimated • CCS options in electricity generation and their costs were estimated • Techno-economic model for optimisation was developed • Several development scenarios were simulated Techno-economic assessment of CCS deployment in Southern Africa | Sandton| May 2011 | 18 World Bank CCS Capacity Building Trust Fund
ConclusionsRole of CCS in the region • Oil/gas fields in SA/Mozambique most cost effective CCS options but storage capacity limited • Botswana coal fields capacity large but more expensive than nuclear • Saline aquifer storage potential even larger but needs more research • In the baseline (SA IRP) scenario with the CO2 constraint, CCS contributes marginally to help SA meet its target. • At $25 and $50 CO2 taxes, Coal CCS with the depleted oil/gas fields in South Africa and Mozambique for storage become cost effective and play a slightly bigger role. • CCS using coal fields for storage only come into play at $100/ton tax. Techno-economic assessment of CCS deployment in Southern Africa | Sandton| May 2011 | 19 World Bank CCS Capacity Building Trust Fund
Possible next steps • Further research of availability and costs of underground storages needed in all the countries in the region to reduce uncertainty • Modeling of Transport and Storage options could be improved • Look further than 2030. • Other constraints on CCS (e.g. water) • Expanding the analysis to the rest of the region • Other sectors e.g. CTL, industrial Techno-economic assessment of CCS deployment in Southern Africa | Sandton| May 2011 | 20 World Bank CCS Capacity Building Trust Fund
Thank you for your attention! Techno-economic assessment of CCS deployment in Southern Africa | Sandton| May 2011 | 21 World Bank CCS Capacity Building Trust Fund
Electricity demand projection ~ 200 TWh SA demand based on IRP 2011, others based on SAPP pool plan study of 2008 Techno-economic assessment of CCS deployment in Southern Africa | Sandton| May 2011 | 22 World Bank CCS Capacity Building Trust Fund
Techno-economic model • MESSAGE (Model for Energy Supply Strategy Alternatives and their General Environmental Impact) • Developed by IIASA (International Institute for Applied System Analysis) and IAEA (International Atomic Energy Agency) • Available free of charge for IAEA member countries • Training available through IAEA TC projects • Physical flow model • Demand driven • Used for medium to long-term energy system planning, energy policy analysis, and scenario development • Linear and mixed integer programming • Built-in multi-regional modeling option Techno-economic assessment of CCS deployment in Southern Africa | Sandton| May 2011 | 23 World Bank CCS Capacity Building Trust Fund
Installed power (2009) • Botswana: Coal Mozambique: Mainly coal with some oil • Namibia: Hydro and Coal South Africa: Mainly coal with some nuclear, and peaking (Pump Storage + OCGTs) Techno-economic assessment of CCS deployment in Southern Africa | Sandton| May 2011 | 24 World Bank CCS Capacity Building Trust Fund
Generation (2009) • Around 87% of power generated from coal thermal, mainly in South Africa Techno-economic assessment of CCS deployment in Southern Africa | Sandton| May 2011 | 25 World Bank CCS Capacity Building Trust Fund
Fuel prices Fuel Prices based on SA IRP 2011 Techno-economic assessment of CCS deployment in Southern Africa | Sandton| May 2011 | 26 World Bank CCS Capacity Building Trust Fund
Generic Technology Options and Costs Technology Costs based on SA IRP 2011 (dry cooling for coal) Technology learning applied to RE Techno-economic assessment of CCS deployment in Southern Africa | Sandton| May 2011 | 27 World Bank CCS Capacity Building Trust Fund
CCS Capture Options Techno-economic assessment of CCS deployment in Southern Africa | Sandton| May 2011 | 28 World Bank CCS Capacity Building Trust Fund
Storage Options Identified and modelled • Storage data from SA CCS Atlas, and limited available geological survey data • EOR benefit estimated by Vito at $40/tonCO2 and ECBM at $4.8/tonCO2 • Some options not modelled because of high uncertainty and costs. • Start year for Namibia and Mozambique oil fields brought forward within model horizon. Techno-economic assessment of CCS deployment in Southern Africa | Sandton| May 2011 | 29 World Bank CCS Capacity Building Trust Fund
SA IRP committed build plan Committed build plan is “forced in” all scenarios. Techno-economic assessment of CCS deployment in Southern Africa | Sandton| May 2011 | 30 World Bank CCS Capacity Building Trust Fund
SA “Revised Balanced” IRP Techno-economic assessment of CCS deployment in Southern Africa | Sandton| May 2011 | 31 World Bank CCS Capacity Building Trust Fund