Download
1 / 42
440 likes | 453 Views
WASH, Child Survival and Development. UNICEF WebEx Training and discussion February 2012 Update. Table of Contents. Diarrhea Global Disease Burden Early Childhood Diarrhoea Effectiveness WASH interventions WASH Disease Burden (excl. diarhoea ) WASH and Nutrition WASH and PLWA

E N D
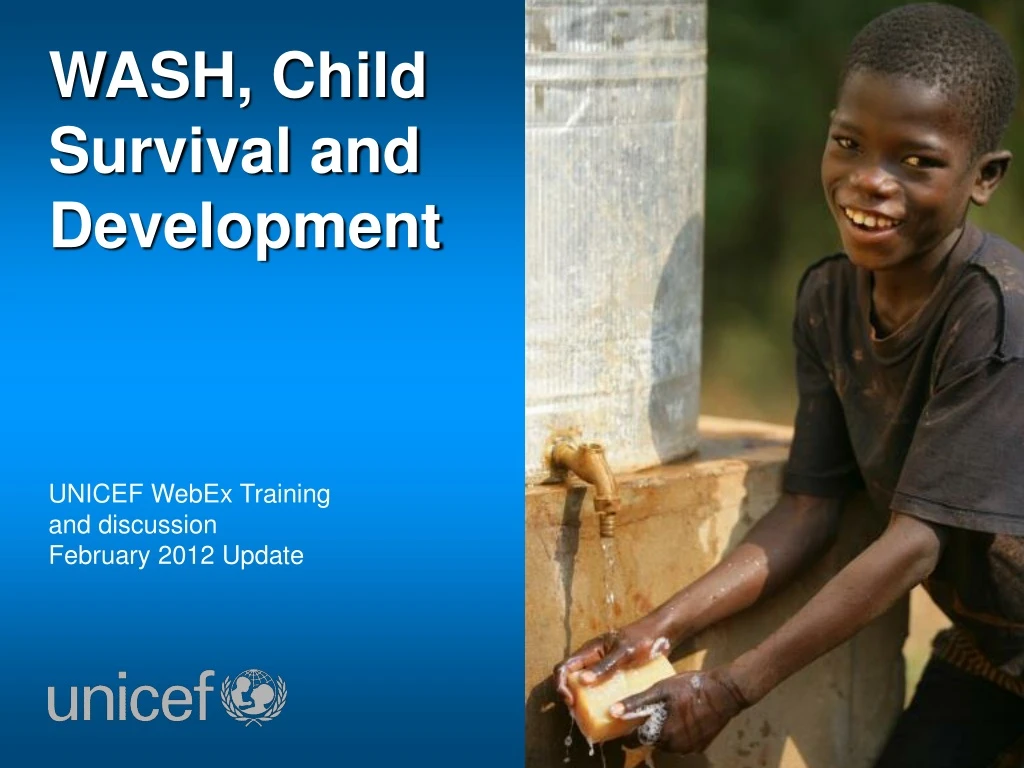
WASH, Child Survival and Development UNICEF WebEx Training and discussion February 2012 Update
Table of Contents • Diarrhea • Global Disease Burden • Early Childhood Diarrhoea • Effectiveness WASH interventions • WASH Disease Burden (excl. diarhoea) • WASH and Nutrition • WASH and PLWA • WASH and Education • Handwashing • Case Studies - Discussion
Definitions Mortality: • Rate of occurrence of death within a population within a specified time period. Morbidity: • Rate of occurrence of disease or other health disorder within a population. Incidence • The number of new events occurring in a defined population in a specified time Prevalence • The number of cases of a given disease in a specified population at a given point in time
Global Burden of Diseases Distribution of Causes of Under 5 Mortality. Source: Black et al 2010
Global Burden of Diseases • The number of children under five years of age dying each year declined from more than 12 million in 1990 to 7.6 million in 2010. Over 70percent of under-five deaths occur within the first year of life. 41% of under five deaths occur within the first month of life (the neonatal period) (UNICEF 2011). • Diarrhoea remains the second largest cause of under-five mortality (U5M). The total share of U5M attributable to diarrhoea is 15% (a total of 1% in the neonatal period, 14% in 1-59 months of live – see figure 1) (Black et al 2010). 15% of 7.6 million translates into 1.14 million under-five deaths annually caused by diarrhoea.
16% of U5 mortality caused by diarrhoea Proportional distribution of cause-specific deaths among children under five years of age, 2004 (UNICEF/WHO 2009)
That translates into 1.5 million annual U5 diarrhoeal deaths Out of these 1.5 million, 80% were under two years old (WHO 2009) Proportional distribution of deaths due to diarrhoeal diseases among children under five years of age, by region and country, 2004 (UNICEF/WHO 2009)
2.5 billion cases among children U5 each year (morbidity) Incidence is highest in the first two years of life and declines as a child grows older (UNICEF/WHO 2009) Proportional distribution of diarrhoea cases among children under five years of age, by region, 2004 (UNICEF /WHO 2009)
It is important to underline that 80% of the total U5M caused by diarrhoea is in fact U2M (UNICEF/WHO 2009). In other words, the large majority of children that die because of diarrhoea do so before their second birthday. In terms of illness, of the 2.5 BILLION cases of diarrhoea a year, incidence is highest in the first two years of life and declines as a child grows older (UNICEF/WHO 2009)Children under 2 years experience an average of three to five episodes of diarrhoea per year in developing countries In some countries, the rate is six to eight episodes per year (Dewey and Mayers 2011). While diarrhoeal incidence peaks at 6–11 months of age.
88 per cent of diarrhoeal deaths worldwide are attributable to unsafe water, inadequate sanitation and poor hygiene (WHO 2008) Effectiveness [%] of WASH Interventions to reduce diarrhea morbidity in children U5 (I3E 2009)
WASH Disease Burden (excluding diarrhoea) Soil Transmitted Helminthes: Hookworm, Roundworm Whipworm Prevalence: 2 billion Mortality: 12,000 Trachoma (blindness) Prevalence: 5 million Mortality: 0 Schistosomiasis (Bilharzia); Prevalence: 200 million Mortality: 15000 LympathicFilariasis Prevalence: 25 million Mortality: 0 Respiratory Infections (23% reduction in morbidity through handwashing with soap) Guinea worm disease (Dracunciliasis) Incidence: <5,000
Prevalence of Soil Transmitted Helminthes is astounding Three hundred million people are severely ill due to worms and of those at least 50% are school-age children (AAW 2003).
Total WASH related Disease Burden Disability Adjusted Life Year (DALY): An indicator of life expectancy combining mortality and morbidity into one summary measure of population health to account for the number of years lived in less than optimal health. It is a health measure developed for calculating the global burden of disease which is also used by WHO, the World Bank and other organizations to compare the outcomes of different interventions.
Deaths and DALYs attributable to water supply, sanitation and hygiene WASH related Deaths WASH related DALYs PEM: protein–energy malnutrition summary statistics on deaths and disability related to water, sanitation and hygiene in 2002 (WHO 2008)
Global Burden of Disease Inadequate WASH facilitates the transmission of a multitude of diseases/conditions, like diarrhoea, soil transmitted helminiths, respiratory infections, malnutrition, trachoma, schistosomiases, lymphatic filariasis and others. Globally, improving water, sanitation and hygiene has the potential to prevent at least 9.1% of the disease burden or 6.3% of all deaths. Children, particularly those in developing countries, suffer a disproportionate share of this burden, as the fraction of total deaths or DALYs attributable to unsafe water, inadequate sanitation or insufficient hygiene is more than 20% in children up to 14 years of age (WHO 2008).
Cost-Effectiveness of WASH interventions to reduce diarrhoea
Cost effectiveness Source: Disease Control Priorities in Developing Countries. Jamison et al 2006 chapter 2 p.41
The association between WASH and Nutritional Status Source: WHO 2007
Association between diarrhoea/growth and helminths/growth Left: average height-for-age z-score (haz) by age and number of episodes of diarrhoea in the first 2 years of life Right: mean height-for-age z-scores by age in children with (diamonds) and without (squares) intestinal helminths
Lancet 2008, Checkley, data pooled from 9 studies 25% of all stunting in 24-month-old children attributable to having five or more episodes of diarrhoea. Lancet 2004, Peru, Checkley. Children lacking adequate sewage connections and using small water-storage containers had a 1·8 cm growth deficit compared with those in households with sewage connections and which used large containers. Esrey 1996, multi-country analysis, sample size almost 17.000 Improvements in sanitation were associated with increases in height ranging from 0.8cm to 1.9cm. (decrease in stunting 4–37% (rural) and 20–46% (urban) WASH conditions are a determinant of Nutritional Status These studies suggests a considerably greater effect than the 2·4% decrease in prevalence of stunting previously estimated in the Lancet Series of 2008 (Lancet 2009, Humphrey).
Opportunity Costs of children to attend school On 52.9% of pupils’ hands in Greece faecal pathogens were present (Kyriacou et al 2009). Handwashing in primary schools and daycare centers reduces the incidence of diarrhea by 30% (Cochrane 2008) More on WASH and Education Sanitation in schools increases attendance, especially for adolescence girls? Handwashing among school children plays a role in reducing absence (Bowen et al 2007 - Lopez-Quintero et al 2009) Children enduring intense infections with whipworm miss twice as many school days as their infection-free peers (WHO 2005). Female primary school attendance ratio in least developed countries = 63%
Evidence that HIV-positive babies with acute diarrhoea are six times more likely to develop persistent diarrhoea (DCR - Keuch et al. 1992) Persistent diarrhea is more frequent in HIV-infected children, and is associated with an 11-fold increase in mortality compared to non-HIV children (WHO 2006) Water Quantity PLWA typically need more water WASH and People Living With HIV/AIDS (PLWA) Hygiene Handwashing with soap: a 58 percent reduction in diarrheal incidence among HIVAIDS patients in USA (Huang 2007). Water Quality: A POU study conducted in Uganda reduced the frequency (by over 30 percent) and severity of diarrhoea in PLHA (Lule et al. 2005).
Outcomes of various handwashing meta-analyses on the reduction in diarrhoea morbidity in children under 5
Handwashing with Soap Most Cost-effective …to prevent diarrhoea related deaths and disease. Acute respiratory infections (ARI’s) Reduction by around 23 % Maternal handwashing 44% increase in neonatal survival rate (1 study in Nepal) Critical measure in controlling pandemic outbreaks of respiratory infections. e.g. Washing hands with soap more than 10 times a day cut the spread of SARS (2006) by 55 per cent. Water alone is not enough, but soap is rarely used for handwashing. Laundry, bathing and washing dishes are seen as the priorities for soap use.
Rates are low. Observed rates of handwashing with soap at critical - range from zero per cent to 34 per cent. Primary schools and daycare centers Handwashing with soap reduces the incidence of diarrhoea by an average of 30 per cent. Handwashing with Soap (2) The lack of soap is not a significant barrier to handwashing With the vast majority of even poor households having soap. Soap was present in 95 per cent of households in Uganda, 97 per cent of households in Kenya and 100 per cent of households in Peru. School Absenteeism. In China, for example, promotion and distribution of soap in primary schools resulted in 54 per cent fewer days of absence among students compared to schools without such an intervention.
Outcomes of various sanitation meta-analyses on the reduction in diarrhoea morbidity in children under 5 (‘sanitation’ here means to use of toilets/latrines) • .
Sanitation (Mortality) Anew study(Semba et al 2011) analysing 40.000 randomly selected households from poor urban and rural areas concludes the following. Compared to having an improved latrine Among rural families, lack of an improved latrine increased under 5 mortality by 29% Among urban families, lack of an improved latrine increased under 5 mortality by 22% Compared to having an improved latrine Among rural families, open defecation increased child mortality by 43% Among urban families, open defecation increased child mortality by 30%
Relationship between the degree of Open-Defecation and the Prevalence of Diarrhoea in villages in Himachal Pradesh, India, 2004 Question: What could explain the enormous difference in diarrhea prevalence when latrine usage goes from 95% to 100%? In effect, even if a small segment of the population continues to practice open defecation, the risk of bacteriological contamination and disease transmission may continue to be high.
Question: Why does this happen / How can this be prevented? % Frequency of Contaminated Samples Mother’s hands Mother’s breasts 2nd caregiver’s hands Baby bed/mattres Baby supply area Bedroom doorknob Mother’s dining table Water jug handle Food prep. Area Family dining table Food storage area Entrance doorknob Wash tub Clothing line
Objective: To measure the individual and combined effect of Handwashing With Soap and Household Water Treatment on reducing diarrhoea, Karachi, Pakistan • Study Results: • Households which received soap • 51% reduction in the prevalence of diarrhea • Households which received household water treatment products • 64% reduction in the prevalence of diarrhea • Households which received household water treatment products and soap • 55% reduction in the prevalence of diarrhea • Households that functioned as control groups (baseline) Question: What could explain the fact that household water treatment and handwashing with soap combined does not result in a higher reduction in diarrhoea than household water treatment alone? Lack of compliance due to complexity of behaviors? Significance of remaining critical pathway due to poor sanitation (adult /infant)? More ambitious programmes may result in an overall lack of focus or attention (which affects compliance) Threshold effects: Not all diarrhoea cases are caused by poor WASH
There are three main forms of acute childhood diarrhoea, all of which are potentially life-threatening and require different treatment courses (WHO 2009): • Acute watery diarrhoea includes cholera and is associated with significant fluid loss and rapid dehydration in an infected individual. It usually lasts for several hours or days. The pathogens that generally cause acute watery diarrhoea include V.cholerae or E. coli bacteria, as well as rotavirus. • Bloody diarrhoea, often referred to as dysentery, is marked by visible blood in the stools. It is associated with intestinal damage and nutrient losses in an infected individual. The most common cause of bloody diarrhoea is Shigella, a bacterial agent that is also the most common cause of severe cases. • Persistent diarrhoea is an episode of diarrhoea, with or without blood, that lasts at least 14 days. Undernourished children and those with other illnesses, such as AIDS, are more likely to develop persistent diarrhoea. Diarrhoea, in turn, tends to worsen their condition.