Download
1 / 3
30 likes | 117 Views
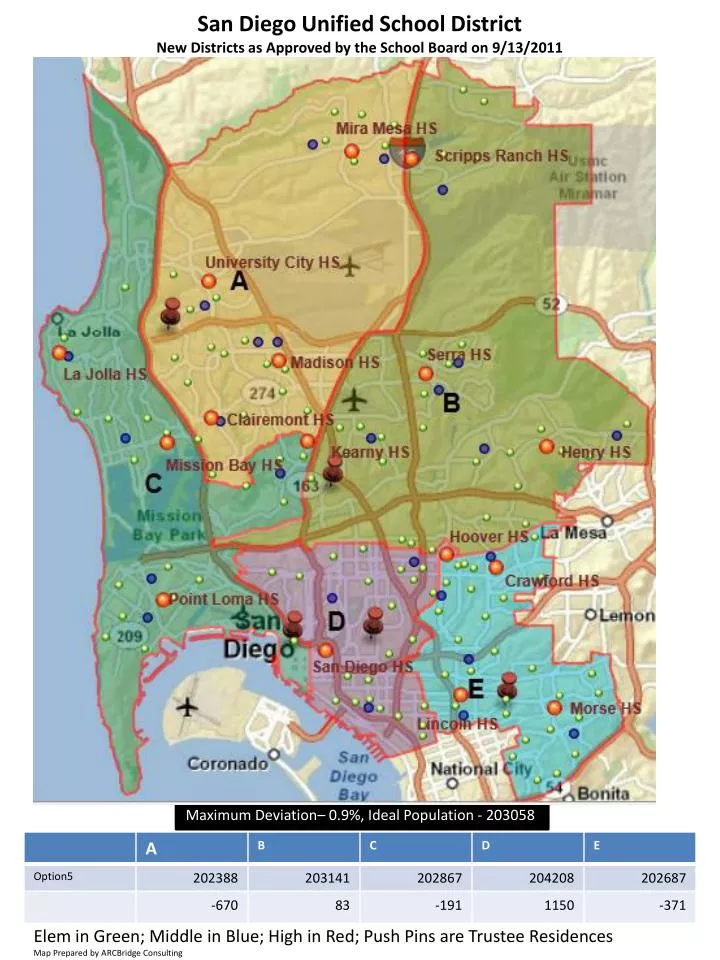
San Diego Unified School District New Districts as Approved by the School Board on 9/13/2011. Maximum Deviation– 0.9%, Ideal Population - 203058. Elem in Green; Middle in Blue; High in Red; Push Pins are Trustee Residences Map Prepared by ARCBridge Consulting.

E N D
San Diego Unified School District New Districts as Approved by the School Board on 9/13/2011 Maximum Deviation– 0.9%, Ideal Population - 203058 Elem in Green; Middle in Blue; High in Red; Push Pins are Trustee Residences Map Prepared by ARCBridge Consulting
Total and Voting Age Population Distribution by Race Total Voting Age Population 813,954 (80% of the Total Population) Total Population 1,015,291 NH MULTI RACE NH MULTI RACE NHASIAN NHASIAN HISPANIC HISPANIC NHBLK NHBLK NHWHT NHWHT NH = Non Hispanic NHAIAN = Non Hispanic American Indian Alaskan native NHNHOPI = Non Hispanic Native Hawaiian and Other Pacific Islander Data Source Census 2010 PL-94-171 Redistricting Data
San Diego Unified School District New Districts as Approved by the School Board on 9/13/2011 Total Population Percentages by Race and by District Voting Age Population Percentages by Race and by District Data Source Census 2010 PL-94-171 Redistricting Data