Download
1 / 49
490 likes | 493 Views

E N D
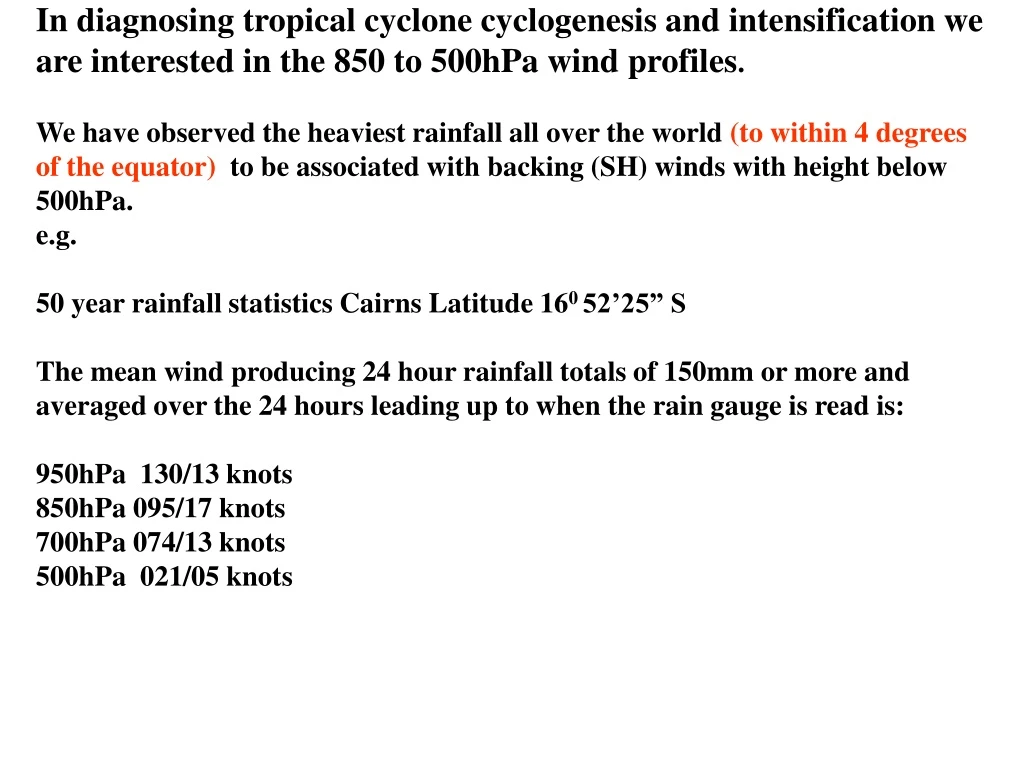
In diagnosing tropical cyclone cyclogenesis and intensification we are interested in the 850 to 500hPa wind profiles. We have observed the heaviest rainfall all over the world (to within 4 degrees of the equator) to be associated with backing (SH) winds with height below 500hPa. e.g.50 year rainfall statistics Cairns Latitude 160 52’25” S The mean wind producing 24 hour rainfall totals of 150mm or more and averaged over the 24 hours leading up to when the rain gauge is read is: 950hPa 130/13 knots 850hPa 095/17 knots 700hPa 074/13 knots 500hPa 021/05 knots
Mumbai 700hPa A useful way to view this wind profile is to plot the 700hPa winds (black) over 850 to 500hPa shears (red) and draw isotherms or thickness lines. This slide shows Mumbai Near 190N under 700hPa flow from warm to cool (isentropic upglide). Mumbai recorded 944mm in the 24h to 0300UTC 27 July 2005
A theoretical example of this with a pattern associated with a MCV in weak shear ---This is a simple example of what is frequently observed in cyclogenesis or intensifying TCsThroughout red (blue) arrows imply areas of isentropic ascent descentnear 700hPa
Journal of the Atmospheric Sciences A Theory for Long-Lived Mesoscale Convective Systems D. J. Raymond1, and H. Jiang11. Non Linear Balance Model Long-lived mesoscale convective systems can maintain themselves through an interaction between quasi-balanced vertical motions and the diabatic effects of moist convection- Leading to creation of a positive potential vorticity anomaly in the lower troposphere.which can interact with a sheared environment so as to induce further lifting of low-level air and subsequent release of conditional instability. The figure shows flow around the PV anomaly After 3 hours into the Simulation.
We will then show 2 cases (MJO related) where the EC can forecast cyclogenesis.The following slide shows one at 700hPa a very accurate EC 144hour forecast of cyclogenesis and the corresponding 700hPa thermal pattern.Is then cyclogenesis largely driven by the large scale (we will also examine upper flow)?
132333Z 142333Z 152333Z 162333Z
Case not forecast well by models (Larry)1st slide shows region from mid latitude extending into tropics (LC1 pattern) Thorncroft et al QJRMS 119, 17-56.2nd slide 700hPa pattern showing shears near 10 to 15 knots near cyclone (EC does’nt forecast these low shear events well).3rd slide showing rapid cyclogenesis from microwaveMain Point is models don’t appear to forecast low sheared events well
L L L H L L L L L H H H 500hPa
0000UTC 14 Mar 2006 0000UTC 15 Mar 2006 0000UTC 16 Mar 2006 0000UTC 17 Mar 2006
0000UTC 14 Mar 2006 0000UTC 15 Mar 2006 0000UTC 16 Mar 2006 0000UTC 17 Mar 2006
Will show some null cases (failed to develop).1. Due to strong upper winds2. Due differential steering between 850 hPa and 500hPavery common way of weakening3.Further example (with dropsonde data) of this differential steering in following 3 slides1st slide 850 ridge building (steering towards west ) but 500hPa trough developing (retarding westward steering at this level)2nd slide showing 700hPa upglide with strong 850/500hPa shears3rd slide schematic of convective process.
CIMSS Vertical Shear AdvisoriesTROPICAL STORM 13P (Kate) 0:00UTC 23February2006UW-CIMSS Experimental Vertical Shear TC Intensity Trend EstimatesCIMSS Vertical Shear Magnitude : 4.3 m/s Direction : 288.3 degOutlook for TC Intensification Based on Current Env. Shear ValuesForecast Interval : 6hr 12hr 18hr 24hr VF VF VF VFThis means 3 hPa per hour deepening TROPICAL STORM 13P (Kate) 6:00UTC 23February2006UW-CIMSS Experimental Vertical Shear TC Intensity Trend EstimatesCIMSS Vertical Shear Magnitude : 4.7 m/s Direction : 274.4 degOutlook for TC Intensification Based on Current Env. Shear Values Forecast Interval : 6hr 12hr 18hr 24hr VF VF VF VFThis means 3 hPa per hour deepening
H H 850 hPa 0000UTC 20/8/2001 850 hPa 0000UTC 21/8/2001 H 500 hPa 0000UTC 21/8/2001 500 hPa 0000UTC 20/8/2001
Dropsondes 1958UTC to 2207 UTC 20 August 2001- 700hPa winds ((black) and shears in red for 850/500hPa and 850hPa/600hPa Dropsondes 2234UTC to 2334 UTC 20 August 2001- 700hPa winds ((black) and shears in red for 850hPa/600hPa
Conceptional model of Chantal (Heymsfield et al) JAS 63, 268-287)
437 439 439 438 438
700hPa warm/cold air advection pattern developing as typhoon Ewiniar formed between latitude 6 and 10 degrees North.
Formation of a microwave eye for typhoon Ewiniar note the main rainband on the warm air advection side of the storm and the lack of convection on the cold air advection side of the storm.
700hPa pattern at the commencement of the period of rapid intensification to a super typhoon and compared with the forecast for this time from 72 hours earlier when the system was still a weak tropical depression.
200hPa and 700hPa sequence just prior to cyclogenesis of Oliver during February 1993
Major point- role of large scale versus mesoscale processes- revisit TC Oliver (Simpson et al MWR 125, 2643-2661)We will show development of the pattern leading up to cyclogenesis –following slide shows cyclogenesis at 700hPa using dropsonde and NCEP reanalyses data
200hPa 2300UTC 31 Jan 1993 200hPa 2300UTC 1 Feb 1993 200hPa 2300UTC 3 Feb 1993 200hPa 2300UTC 2 Feb 1993
700hPa 2300UTC 31 Jan 1993 700hPa 2300UTC 1 Feb 1993 700hPa 2300UTC 2 Feb 1993 700hPa 2300UTC 3 Feb 1993
700hPa 2300UTC 4 Feb 1993 Dropsondes 1753UTC to2144UTC 700hPa 1700UTC 4 Feb 1993 Dropsondes 1509UTC to 1729UTC
700hPa 2300UTC 4 Feb 1993 200hPa 2300UTC 4 Feb 1993 Oliver named as a tropical cyclone
SSMI 85H 1129UTC 5 Feb 2005 SSMI 85H 2050UTC 5 Feb 2005 AQUA-89H 0430UTC 7 Feb 2005 AQUA-1 89H 1616UTC 6 Feb 2005
700hPa 2300UTC 5 Feb 2005 700hPa 2300UTC 4 Feb 2005 700hPa 2300UTC 6 Feb 2005
Final point addresses rapidly developing strongly sheared systems where 500hPa vortex/trough moves over centre- Not forecast well by models and applying Dvorak constraints prevents warnings being issuedExample of rapid development in following slide.
700hPa observations during rapid genesis of Kelvin 200hPa observations (right) and storm relative winds and streamlines in blue.
tropical cyclone Kelvin at Peak intensity near Willis Island at 12300UTC 25 February 1991. The wind at Willis Island was southerly averaging 65 knots and gusting to 85 knots.
2332UTC 7 March 2005 Undulation + Warm air advection 200hPa 250 hPa outflow
0330 UTC 7 March 2001 0330 UTC 8 March 2001 Arrows Marks Yamba. Worst Damage There Between 0800 UTC and 1000 UTC.
warm -51.10C