Download
1 / 55
550 likes | 701 Views
Board of Directors William H. Dunlap, Chair David Alukonis Eric Herr Dianne Mercier James Putnam Stephen J. Reno Todd I. Selig Michael Whitney Daniel Wolf Martin L. Gross, Chair Emeritus Directors Emeritus Sheila T. Francoeur Stuart V. Smith, Jr. Donna Sytek Brian F. Walsh

E N D
Board of Directors William H. Dunlap, Chair David Alukonis Eric Herr Dianne Mercier James Putnam Stephen J. Reno Todd I. Selig Michael Whitney Daniel Wolf Martin L. Gross, Chair Emeritus Directors Emeritus Sheila T. Francoeur Stuart V. Smith, Jr. Donna Sytek Brian F. Walsh Kimon S. Zachos Understanding Boundaries Leadership Seacoast retreat January 8, 2014 “…to raise new ideas and improve policy debates through quality information and analysis on issues shaping New Hampshire’s future.”
Percent Change in NH Population 30.0% 24.8% 25.0% 21.5% 20.5% 20.0% 13.8% 15.0% 11.4% 8.5% 10.0% 6.9% 5.0% 0.0% 1950 1960 1970 1980 1990 2000 2010 Growth Source: New Hampshire Center for Public Policy Studies, analysis of U.S. Census data
Coming and going Demographics has shaped New Hampshire’s destiny over the past four decades. Over that time, tens of thousands more people moved to the state than left. That population growth resulted in higher education levels, increases in average personal income and higher productivity for the state economy. But that trend has reversed itself in recent years (See pink circle. Data for 2012 is not yet available.) What steps can policymakers take in 2013 to address this slow-down in economic and population growth? Or is such growth even desirable?
Aging New Hampshire began the 20th Century with the majority of its population under the age of 30 and relatively few aged 60 and older. Watch how that shifts through the decades. Look out especially for the bump that arrives in the 1950 Census – the Baby Boom Generation – and see how they dominate the subsequent decades. (When you’ve watched the entire cycle, through 2010, press the down arrow key to continue the presentation.)
Has Anything Changed? The Right The Left ?
1984 Voting Patterns Change
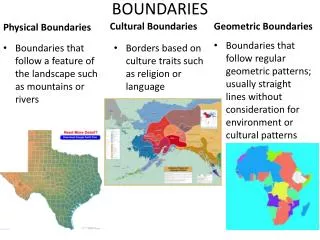
Agenda: What is the Seacoast? • Hope you walk away with • A better understanding of ‘the Seacoast’ • An understanding of the Seacoast as compared to the rest of the state • A grounding in the major policy issues you will be asked to take a leadership role on in the future • Justice, Education, Arts and Culture, Economic Development, Environment, Government • An understanding of the tension between regional and local issues and policies
Here’s a basic overview of New Hampshire’s population according to the Census data from 2010. Not many surprises here. The most densely populated areas are in the state’s southern areas, particularly Rockingham, Hillsborough and Merrimack counties. The highest population centers are in and around Manchester and Nashua, with pockets of density scattered in the cities. The North Country remains sparsely populated. Total state population increased 6.5 percent since 2000, with 1.3 million people now calling New Hampshire home. But let’s look at how that population has shifted over the past decade….. 15
Pictionary – Draw the Seacoast • 5 School Administrative Units • 4 Highways • 3 Economic Development Hubs • 3 Hospitals • 1 Mental Health Center • 1 Community Health Center • 1 University
Labor Markets Hospital Service Areas Tourist Regions Watersheds Housing Markets
This map details where the growth and loss in population, town by town, occurred since 2000. Some obvious points: the biggest increases came in Hillsborough and Rockingham counties. We can also see the influence that Interstate 93 has on population growth over the past decade. Other pockets of large increase: the Conway and Plymouth regions, the Lakes Region and the Upper Valley. We’ll return to those later. And while nearly every region saw some increase in population, the declines were focused largely on the North Country.
But while the overall state population increased, the number of school-aged children fell: a loss of more than 22,000 students, or a 7 percent decline since 2000. As this map shows, that drop was spread across the state, with a few towns gaining in school-age population. But flip back to the previous map. You’ll see that many of the areas that had the biggest gains in total population saw a decline in their school-aged numbers: portions Hillsborough County and the Rochester area, for instance. How might that trend shape discussions about education spending, both at the state and local level? More broadly, policymakers will have to consider what steps to take to build the education system in a state where the student population is declining.
A Dynamic System Coughlin et. Al. “Demographics, Destiny, and Anticipating the Future of the Transportation System.
Water is not a local issue
Studies Looking at Needs/ Demand Wright and Pierce. 1011. “Drinking Water Infrastructure in New Hampshire: A Capital Investment Needs Analysis”
Healthcare is local but …. ? New Hampshire Hospitals 30 Minute Drive Time
Watch NH’s Population Change New Hampshire began the 20th Century with the majority of its population under the age of 30 and relatively few aged 60 and older. Watch how that shifts through the decades. Look out especially for the bump that arrives in the 1950 Census – the Baby Boom Generation – and see how they dominate the subsequent decades. (When you’ve watched the entire cycle, through 2010, press the down arrow key to continue the presentation.)
The most recent Census numbers help paint a more detailed portrait of New Hampshire’s demographic patterns. In this map, the darker the shade of the community, the older the median age of its residents. (The statewide median age was 41.1 years in 2010, up from 37.1 in 2000.) We see here that New Hampshire can essentially be divided into two regions when it comes to age: an older northern half, and a younger southern half. But even in the “younger” half, there is a further subdivision, with the eastern region – between Interstate 93 and the Seacoast -- significantly younger than the western portion. How might those divisions shape future policy discussions related to health care, education and public spending? (White areas of the map are unincorporated areas for which the Census Bureau did not release information.) 38
This map plots the oldest segment of the population – those aged 85 and older – town by town. (Statewide, 1.9 percent of New Hampshire’s population was 85 or older in 2010.) The darker communities, those with a higher share of elderly residents, will face additional challenges in caring for that population. And as New Hampshire ages faster than the nation as a whole, these communities will pave the way for the kinds of changes likely facing the rest of the state in coming years. An older population requires a different mix of social, health care, housing, transportation and other services. How can New Hampshire best prepare for those needs?
US Economy Alternative Scenarios • Stronger Near Term Rebound – Jobs and housing grow more than expected (10% probability) • Slower Near Term – US business confidence drops due to Washington Gridlock & Europe recession worsens (25% probability) • Source: Moody’s Analytics, August 2013 Page 41
In this context, where should we invest? Health Care Education/Workforce Natural and Cultural Resources Energy Fiscal Infrastructure Workforce Housing Regulatory Business Growth and Retention 44
Public Policy Indicators Compared to Neighbor and Competitor States