Download
1 / 20
200 likes | 739 Views
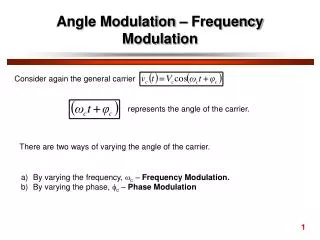
Cavity-Enhanced Velocity Modulation Spectroscopy. Brian Siller , Andrew Mills & Benjamin McCall University of Illinois at Urbana-Champaign. Velocity Modulation Spectroscopy. Positive column discharge cell High ion density, rich chemistry Cations move toward the cathode. +1kV. -1kV.

E N D
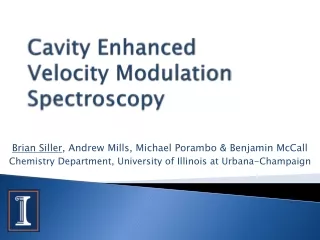
Cavity-Enhanced Velocity Modulation Spectroscopy Brian Siller, Andrew Mills & Benjamin McCall University of Illinois at Urbana-Champaign
Velocity Modulation Spectroscopy • Positive column discharge cell • High ion density, rich chemistry • Cations move toward the cathode +1kV -1kV Plasma Discharge Cell
Velocity Modulation Spectroscopy • Positive column discharge cell • High ion density, rich chemistry • Cations move toward the cathode • Ions absorption profile is Doppler-shifted +1kV -1kV Laser Detector Plasma Discharge Cell
Velocity Modulation Spectroscopy • Positive column discharge cell • High ion density, rich chemistry • Cations move toward the cathode • Ions absorption profile is Doppler-shifted -1kV +1kV Laser Detector Plasma Discharge Cell
Velocity Modulation Spectroscopy • Positive column discharge cell • High ion density, rich chemistry • Cations move toward the cathode • Ions absorption profile is Doppler-shifted • Drive with AC voltage • Ion Doppler profile alternates red/blue shift • Laser at fixed wavelength • Demodulate detector signal at modulation frequency Laser Detector Plasma Discharge Cell
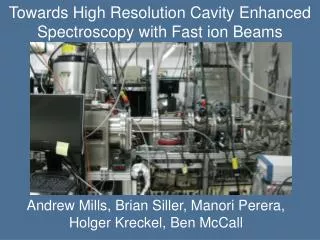
Velocity Modulation Spectroscopy • Want strongest absorption possible • Signal enhanced by modified White cell • Laser passes through cell unidirectionally • Can get up to ~8 passes through cell Laser Plasma Discharge Cell Detector
Cavity Enhanced Absorption Spectroscopy (CEAS) • Optical cavity acts as a multipass cell • Number of passes = • For finesse of 150, get ~100 passes • Must actively lock laser wavelength/cavity length to be in resonance with one another • DC signal on detector is extremely noisy • Velocity modulation with lock-in amplifier minimizes effect of noise on signal detection Cavity Detector Laser
Pound-Drever-Hall Locking Detector Ti:Sapph Laser Cavity Transmission EOM PZT Detector Error Signal 14MHz Lock Box
CEVMS Setup Audio Amplifier 40 kHz Lock-In Amplifier Transformer Laser Cavity Mirror Mounts
Extracting N2+ Absorption Signal • Doppler profile shifts back and forth • Red-shift with respect to one direction of the laser corresponds to blue shift with respect to the other direction • Net absorption is the sum of the absorption in each direction Absorption Strength (Arb. Units) Relative Frequency (GHz)
Extracting N2+ Absorption Signal V (kV) t (μs) Absorption Relative Frequency
Extracting N2+ Absorption Signal • Demodulate detected signal at twice the modulation frequency (2f) • Can observe and distinguish ions and neutrals • Ions are velocity modulated • Excited neutrals are concentration modulated • Ground state neutrals are not modulated at all
Typical Scan of Nitrogen Plasma • Cavity Finesse 150 • 30mW laser power • N2+ Meinel Band • N2* first positive band • Second time a Lamb dip of a molecular ion has been observed (first was DBr+ in laser magnetic resonance technique)1 • Used 2 lock-in amplifiers for N2+/N2* 1M. Havenith, M. Schneider, W. Bohle, and W. Urban; Mol. Phys. 72, 1149 (1991).
Phase Analysis V (kV) • N2+ • Velocity directly dependent on voltage • No significant phase shift with respect to voltage • N2* • 78° phase shift with respect to N2+ signal • Peak N2* density occurs when rate of formation equals rate of destruction t (μs) Peak N2* Density
Phase Analysis • N2+ • Velocity directly dependent on voltage • No significant phase shift with respect to voltage • N2* • 78° phase shift with respect to N2+ signal • Peak N2* density occurs when rate of formation equals rate of destruction • Analogous to Earth’s heating/cooling cycle with the sun • Sun is brightest at noon (peak voltage) • Hottest time of day is 5pm (peak N2* density) • 5 hour time delay in 24 hour day = 75° phase shift
Advantages Over Traditional Velocity Modulation • Potentially orders of magnitude more sensitivity • Allows for saturation spectroscopy • Resolve Doppler-blended lines • Better line center determination • Width of Lamb dip allows more information to be extracted from spectra • (See talk FD02 for much more detail)
Potential Improvements • Better isolation of plasma noise • Faraday cage • Dedicated grounding • Improved cavity locking • Less noise induced by lock to cavity • Allow for locking to a higher finesse cavity • Heterodyne Detection
CEVMS Summary • Improves upon absorption strength of velocity modulation experiments • Allows for Doppler-free spectroscopic studies of molecular ions • Very general technique • To unlock full potential, must first minimize plasma noise with careful experimental setup
Acknowledgements • McCall Group • Funding • Air Force • NASA • Dreyfus • Packard • NSF • Sloan