Download
1 / 54
570 likes | 855 Views
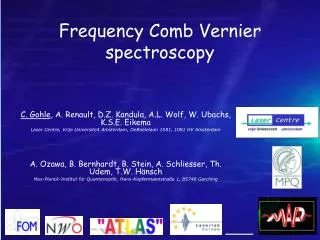
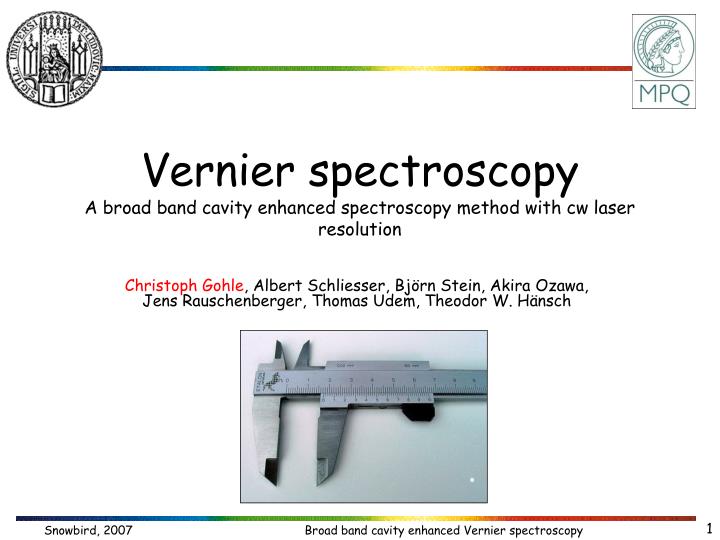
Vernier spectroscopy A broad band cavity enhanced spectroscopy method with cw laser resolution. Christoph Gohle , Albert Schliesser, Björn Stein, Akira Ozawa, Jens Rauschenberger, Thomas Udem, Theodor W. Hänsch. Outline. Cavity enhanced spectroscopy Broad band cavity enhanced methods

E N D
Vernier spectroscopyA broad band cavity enhanced spectroscopy method with cw laser resolution Christoph Gohle, Albert Schliesser, Björn Stein, Akira Ozawa, Jens Rauschenberger, Thomas Udem, Theodor W. Hänsch
Outline • Cavity enhanced spectroscopy • Broad band cavity enhanced methods • Adding phase sensitivity • The optical vernier • Conclusion
Fabry perot resonators light source
… enhance sensitivity • Cavity enhanced absorption spectroscopy (CEAS) • Increased interaction length ( ), i.e. sensitivity • Cavity ring down (CRD) • Rejects source noise
Broad band CEAS R • Broadband input source • Low transm. (1 ) • Sens. gain ~ • Frequency comb input* • Sens. gain ~ • Ringdown method using streak camera possible** • Narrow probe frequencies (if resolved) Spectrometer BB-Source (S) T S R T S R T *Gherman, T. & Romanini, D., Optics Express, 10, 1033-1042 (2002) **Thorpe, M.J. et al., Science, 311, 1595-1599 , 2006
laser frequency comb Comb matching • In general r and 'will be complicated functions of ! passive cavity … and the two combs can not be lined up
Some results • Yields both loss and dispersion • Frequency comb is a “dispersion free” reference • Sensitivity ~ Finesse • Demonstrated sens.: 10-6/cm, 1fs2@2THz resolution • Resolution limited by spectrometer • May be useful for survey trace gas detection A. Schliesser et al., Optics Express, 14, 5975-5983 (2006)
What about the comb? The optical Vernier
Idea n= nr +CE n+1 n c • Requirements: • Finesse > m • m r > spec. resolution
Model Close to a spot (k,l) the contributions of all other frequencies can be neglected: … 3 2 1 k=0 l=0 1 2 3 … Scanning length: Sample absorbtion: Y calibration: Identified comb modes: k+m,l=k,l+1!2=(yk+m,l-yk,l+1)/c Assuming: n(k,l+1)=1 Steady state condition: one line width in more than one lifetime: Scanspeed < ( FSR)2/Finesse2
Implementation CCD grating lens Air Resonator Finesse ~ 3000
Data • Single scan (10ms) • Blue box: unique data • Red boxes: identified features • Gaussian PSF much larger than airy ! Brightness~Integral of airy
Results* • Absorbtion: • Noisefloor • < 10-5/cm (100 Hz)1/2= • < 10-6/cm Hz1/2 • > 4 THz bandwidth • 1 GHz sampling (>4000 res. • Datapoints in 10 ms) • Quantitative agreement in • Amplitude and Frequency • to HITRAN** database • Phase: • *looks good (dispersive features) • *not optimized for good phase sensitivity O2 A-Band No Free parameters (except frequency offset, which was not measured here) * To be published in the near future ** Rothman, L. S. et al., J. Quant. Spect. Rad. Trans., 96, 139-204 (2005)
Conclusions • Pro’s • Comb resolution (i.e. Hz level if desired) • Fast (partly parallel acquisition) • Simple • Large bandwidth • Amplitude AND Phase sensitivity • Self calibrating • Reproducibility limited by primary frequency standard only • Subdoppler methods easily conceivable • Con • Transmitted power ~ 1/Finesse • Sensitivity Gain ~ Finesse1/2 only (for shot noise limited detection) Thank you for your attention!
… enhance nonlinear conversion • Pc=F/ • Output power grows with finesse2 or higher! • Example: • SHG 560nm->280nm • 900mW driving power • 20% conversion: 900mW->200mW
f=p/2 f=p f=0 - cosine-pulse cosine-pulse sine-pulse +¥ S Am e-imwrt-iwct = m=-¥ I(w) 1 wc Basics E(t)=A(t)eiwct !n = n!r +!CE !CE=ÁCE/T • Optical clockwork, connects optical and radio frequency • 106 phaselocked cw-lasers for high accuracy spectroscopy
3,000,000 modes with 0.3 mW power spectrosopy with a single mode hard but possible: V.Gerginov et al. Optics Letters, 30, 1734 (2005) 1 Spectroscopy with Combs I(1) 300 THz band width and 100 MHz mode spacing. 1 300 THz
all modes contribute. like a cw laser. Two photon spectroscopy I(1) 1 Pionieered by: Ye.V.Baklanov, V.P.Chebotayev, Appl. Phys 12, 97 (1977) and M.J.Snadden, A.S.Bell, E.Riis, A.I.Ferguson, Opt. Comm. 125, 70 (1996)
… recent results • Cs 6S-8S two photon transition Peter Fendel et al., (… almost submitted) Similar method: A. Marian et al, PRL, 95, 023001 (2005)
Comb Spectroscopy? • Fs-frequency combs combine • High peak power of a fs-laser • High spectral quality of cw-laser • Good for applications where there are no continous lasers available • First impressive steps: S. Witte et al., Science, 307, 400 (2005) • Highly nonlinear spectroscopy?
High Accuracy at high Energy? • Planck Scale • Frequency measurements • Optical atomic clocks
Hydrogen likeHe+ • He+ is an ion • Can be trapped and cooled • Long interaction times • Reduced (eliminated) Doppler broadening & shift • Control over other systematics • Reduced (no) recoil
Fs-Buildup resonator • Enhance entire frequency comb • Produce XUV frequency comb • Via high order harmonic generation
intracavity: • Pavg = 38 W • = 28 fs • Ppeak = 12 MW seed laser: Pavg = 700 mW t = 20 fs Ppeak = 300 kW x55 x40 Real resonator
XUV Output Output: 10nW C. Gohle et al., Nature, 436, 234 (2005) R. J. Jones et al., PRL, 94, 193201 (2005)
? High Harmonics Hierarchy
Coherence (of the 3rd harm.) C. Gohle et al., Nature, 436, 234 (2005) R. J. Jones et al., PRL, 94, 193201 (2005)
intracavity: • Pavg = 38 W • = 28 fs • Ppeak = 12 MW seed laser: Pavg = 700 mW t = 20 fs Ppeak = 300 kW x55 x40 Real resonator Lost a factor of 2!
Complete resonator characterization With high sensitivity
Experimental Setup f-to-2f interferometer 2x piezo-actuated mirrors photodiode+counter silica wedges in laser
Data from an “empty” cavity A. Schliesser et al., Optics Express, 14, 5975-5983 (2006)
Result • to cover entire spectrum, perform multiple measurements with different lock points (here 780.5 and 801.0 nm) • wide bandwidth: 150nm • „wiggles“ at 760 and 825 nm? • empirical reproducibility: 1fs² in GDD (1.6 THz BW) and 4*10-4 in r
Verification Sapphire plate @ Brewster‘s angle 2 identical high-reflectivity dielectric stack mirrors Measurement of cavity before and after insertion of additional components yields individual contributions.
Empty cavity? • to cover entire spectrum, perform multiple measurements with different lock points (here 780.5 and 801.0 nm) • wide bandwidth: 150nm • „wiggles“ at 760 and 825 nm? • empirical reproducibility: 1fs² in GDD (1.6 THz BW) and 4*10-4 in r
Comparison with simulation HITRAN data, convoluted with spectrometer ILS and multiplied with 0.98 HITRAN data (RT, 1atm, 21%) Phase excursion ~10-3 rad (on top of a simple quadratic phasedep.) n ~ 5 £ 10-11 L. S. Rothman et al., The HITRAN 2004 molecular spectroscopic database," J. Quant. Spect. Rad. Trans. 96, 139-204, (2005)
Air filled resonator! O2 H2O • to cover entire spectrum, perform multiple measurements with different lock points (here 780.5 and 801.0 nm) • wide bandwidth: 150nm • „wiggles“ at 760 and 825 nm? • empirical reproducibility: 1fs² in GDD (1.6 THz BW) and 4*10-4 in r
Input: 120nJ, 30fs, 4MW peak x 100 12µJ, 30fs, 400MW peak High power XUV comb seed laser: 10 MHz CPO (120 nJ; 30 fs) enhancement cavity: vacuum setup (3.5 m length)
… provide stable references • Narrow Markers in Frequency space • If high finesse • High stability • ~10-14 @ 1 s • Few Hz linewidth @ 1 PHz