Download
1 / 39
410 likes | 548 Views
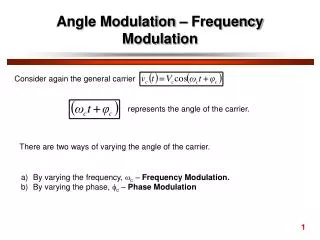
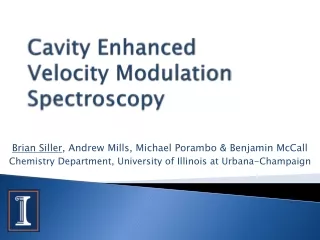
Cavity Enhanced Velocity Modulation Spectroscopy. Brian Siller , Michael Porambo & Benjamin McCall Chemistry Department University of Illinois at Urbana-Champaign. Ion Spectroscopy. Applications Astrochemistry Fundamental physics Goals Completely general (direct absorption)

E N D
Cavity EnhancedVelocity Modulation Spectroscopy Brian Siller, Michael Porambo & Benjamin McCall Chemistry Department University of Illinois at Urbana-Champaign
Ion Spectroscopy • Applications • Astrochemistry • Fundamental physics • Goals • Completely general (direct absorption) • High resolution
Ions & Astrochemistry • Molecular ions are important to interstellar chemistry • Ions important as reaction intermediates • >150 Molecules observed in ISM • Only ~20 are ions • Need laboratory data to provide astronomers with spectral targets C6H6 C6H7+ e H2 C6H5+ C2H2 C4H3+ H C4H2+ C3H2 C3H C C3H3+ e e H2 C3H+ C+ C2H2 C2H e C2H4 C2H3+ e C2H5+ e C+ CH4 CH3+ e CH3OCH3 CH5+ C2H5CN CH3OH, e CH3CN, e H2O, e CH3OH H2 HCN, e CH3CN CH3+ CO, e NH3, e CH2CO CH3NH2 e H2 N, e CH2+ CH HCN H2O H2 H3O+ e CH+ OH H2O+ H2 C OH+ HCO+ H2 H3+ O CO H2 H2+
Indirect Terahertz Spectroscopy • Combination differences to compute THz transitions by observing rovibrational transitions in the mid-IR • Support for Herschel, SOFIA, and ALMA THz observatories 60-670 µm 0.3-1600 µm 3-400 µm
Indirect Terahertz Spectroscopy J’ 4 IR Transitions Even Combination differences Odd Combination Differences 1-0 Rotational Transition Reconstructed Rotational Transitions 3 cm-1 2 1 0 6 5 cm-1 4 3 2 1 0 J”
Fundamental Physics • CH5+ is a prototypical carbocation • SN1 reaction intermediates • Highly fluctional structure • Spectrum completely unassigned E.T. White, J. Tang, and T. Oka, “CH5+: The Infrared Spectrum Observed”, Science, 284, 135-137 (1999). Animation from Joel Bowman, Emory University
Direct Absorption Techniques • Ion Beam • Rigorous ion-neutral discrimination • Mass-dependent Doppler shift • Positive Column • High ion density • Simple setup
Velocity Modulation Spectroscopy • Positive column discharge cell • High ion density, rich chemistry • Cations move toward the cathode +1kV -1kV Plasma Discharge Cell
Velocity Modulation Spectroscopy • Positive column discharge cell • High ion density, rich chemistry • Cations move toward the cathode • Ions absorption profile is Doppler-shifted +1kV -1kV Laser Detector Plasma Discharge Cell
Velocity Modulation Spectroscopy • Positive column discharge cell • High ion density, rich chemistry • Cations move toward the cathode • Ions absorption profile is Doppler-shifted -1kV +1kV Laser Detector Plasma Discharge Cell
Velocity Modulation Spectroscopy • Positive column discharge cell • High ion density, rich chemistry • Cations move toward the cathode • Ions absorption profile is Doppler-shifted • Drive with AC voltage • Ion Doppler profile alternates red/blue shift • Laser at fixed wavelength • Demodulate detector signal at modulation frequency Laser Plasma Discharge Cell Detector
Velocity Modulation Spectroscopy • Want strongest absorption possible • Signal enhanced by modified White cell • Laser passes through cell unidirectionally • Can get up to ~8 passes through cell Laser Plasma Discharge Cell Detector • Also want lowest noise possible, so combine with heterodyne spectroscopy
Velocity Modulation of N2+ • Single-pass direct absorption • Single-pass Heterodyne @ 1GHz 0 1 2
Velocity Modulation Limitations • Doppler-broadened lines • Blended lines • Limited determination of line centers • Sensitivity • Limited path length through plasma • Improve by combining with cavity enhanced absorption spectroscopy
Pound-Drever-Hall Locking Cavity Transmission Ti:Sapph Laser Error Signal Detector PZT Polarizing Beamsplitter EOM Detector AOM 30MHz Quarter Wave Plate Lock Box 0.1-60kHz <100Hz
CEVMS Setup Audio Amplifier 40 kHz Lock-In Amplifier Transformer Laser Cavity Mirror Mounts
Extracting N2+ Absorption Signal • Doppler profile shifts back and forth • Red-shift with respect to one direction of the laser corresponds to blue shift with respect to the other direction • Net absorption is the sum of the absorption in each direction Absorption Strength (Arb. Units) Relative Frequency (GHz)
Extracting N2+ Absorption Signal • Demodulate detected signal at twice the modulation frequency (2f) • Can observe and distinguish ions and neutrals • Ions are velocity modulated • Excited neutrals are concentration modulated • Ground state neutrals are not modulated at all • Ions and excited neutrals are observed to be ~75° out of phase with one another
Typical Scan of Nitrogen Plasma • Cavity Finesse 150 • 30mW laser power • N2+ Meinel Band • N2* first positive band • Second time a Lamb dip of a molecular ion has been observed (first was DBr+ in laser magnetic resonance technique)1 • Used 2 lock-in amplifiers for N2+/N2* B. M. Siller, A. A. Mills and B. J. McCall, Opt. Lett., 35, 1266-1268. (2010) 1M. Havenith, M. Schneider, W. Bohle, and W. Urban; Mol. Phys. 72, 1149 (1991)
Precision & Accuracy • Line centers determined to within 1 MHz with optical frequency comb • Sensitivity limited by plasma noise 0 1 2 A. A. Mills, B. M. Siller, and B. J. McCall, Chem. Phys. Lett., 501, 1-5. (2010)
NICE-OHMS • Noise Immune Cavity Enhanced Optical Heterodyne Molecular Spectroscopy Cavity Modes Laser Spectrum J. Ye, L. S. Ma, and J. L. Hall, JOSA B, 15, 6-15 (1998)
Experimental Setup Ti:Sapph Laser Detector PZT Polarizing Beamsplitter EOM Detector AOM 30MHz Quarter Wave Plate Lock Box
Experimental Setup Detector PZT Ti:Sapph Laser EOM
Experimental Setup Detector PZT Ti:Sapph Laser EOM EOM 90° Phase Shift 113 MHz Cavity FSR Lock-In Amplifier Lock-In Amplifier 40 kHz Plasma Frequency X Y X Y Absorption Signal Dispersion Signal
Results 113 MHz Sidebands 1 Cavity FSR Dispersion Absorption Lock-In X Lock-In Y
Dispersion Absorption Lock-In X Lock-In Y No center Lamb dip in absorption Spectra calibrated with optical frequency comb Frequency precision to <1 MHz!
Ultra-High Resolution Spectroscopy Absorption Dispersion 113MHz Sub-Doppler fit based on pseudo-Voigt absorption and dispersion profiles (6 absorption, 7 dispersion) Line center from fit: 326,187,572.2 ± 0.1 MHz After accounting for systematic problems, line center measured to within uncertainty of ~300 kHz!
Technique Comparison VMS OHVMS NICE-OHVMS CEVMS NICE-OHVMS
NICE-OHVMS Summary • Better sensitivity than traditional VMS • Increased path length through plasma • Decreased noise from heterodyne modulation • Retained ion-neutral discrimination • Sub-Doppler resolution • Better precision & absolute accuracy with comb • Resolve blended lines • Can use same optical setup for ion beam spectroscopy
Experimental Setup Ion Beam Instrument Detector PZT Ti:Sapph Laser EOM EOM Lock-In Amplifier Lock-In Amplifier 40 kHz Plasma Frequency X Y X Y Absorption Signal Dispersion Signal
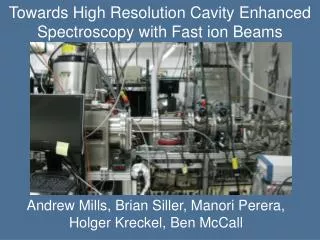
Ion Beam Spectrometer S _ R I Be S Laser retractable Faraday cup Brewster window Einzel lens 2 TOF beam modulation electrodes electrostatic deflector 2 wire beam profile monitors electron multiplier TOF detector drift tube (overlap) variable apertures Ion source electrostatic deflector 1 Ion optics steerers ion source Current measurements Co-linearity with laser Mass spectrometer Laser coupling Velocity modulation ±5V ~ ±100MHz Einzel lens 1 Faraday cup Brewster window Ground 4kV 2kV
Ion Beam Results • 4kV float voltage • ±5V modulation • ~120MHz linewidth • Ion density ~5×106 cm-3 • Cavity finesse ~450 • Lock-in τ=10s Float voltage Ion mass
Unique Advantages • Ion Beam • Rigorous ion-neutral discrimination • Simultaneous mass spectroscopy • Mass identification of each spectral line • No Doppler-broadened component of lineshape • Positive Column • High ion density • Simpler setup • Direct measurement of transition rest frequency
Current Work • Positive Column • Mid-IR OPO system • ~1W mid-IR idler power • Pump and signal lasers referenced to optical frequency comb • Liquid-N2 cooled discharge cell • Ion Beam • Mid-IR DFG laser • Ti:Sapph referenced to comb • Nd:YAG locked to I2 hyperfine transition • Supersonic expansion discharge source
Acknowledgements • McCall Group • Ben McCall • Michael Porambo • Funding