Download

1 / 32
320 likes | 394 Views
Analysis of a Multimodal Light Rail Corridor using an Activity-Based Microsimulation Framework. S . Ellie Volosin & Ram M. Pendyala , Arizona State University, Tempe, AZ Brian Grady & Bhargava Sana , Resource Systems Group, Inc. Brian Gardner , Federal Highway Administration, Washington DC.

E N D
Analysis of a Multimodal Light Rail Corridor using an Activity-Based Microsimulation Framework S. Ellie Volosin & Ram M. Pendyala, Arizona State University, Tempe, AZ Brian Grady & Bhargava Sana, Resource Systems Group, Inc. Brian Gardner, Federal Highway Administration, Washington DC May 8 – 12, 2011; Reno, Nevada 13th TRB National Transportation Planning Applications Conference
Outline • Background • Project overview and objectives • Geographical area and regional network • Preparing the network • Trip-based demand • Execution of TRANSIMS • Trip-based results • Light rail line extensions • Synthetic activity file generation • Activity-based analysis - preliminary results • Ongoing work and Conclusions
Background • Need for planning tools that offer greater level of detail • Disaggregate models better able to replicate human behavior more closely • Microsimulation models track each traveler individually • Limited work on microsimulationoftransit modes
Project Overview • TRANSIMS deployment case study in Greater Phoenix Metropolitan Region • Funded by Federal Highway Administration • Emphasis on two developments • Microsimulation of transit modes • Activity demand generation module • Application to a mixed mode corridor including auto, bus, and rail modes
Project Objectives • Implement, calibrate, and validate TRANSIMS model • Evaluate performance of mixed mode network • Intersection delay • Rail crossings • Transit transfers and boardings • Use calibrated model to predict conditions with future light rail extensions
About the Greater Phoenix Region • 4.28 million people in the metropolitan area • City of Phoenix is the 5th largest in the U.S. • Eight separate cities in the region with more than 100,000 people each
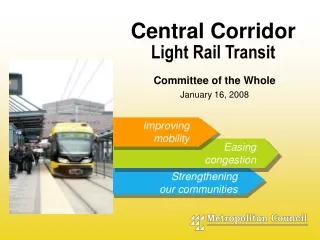
Light Rail System • Light Rail Transit (LRT) line began service in Dec, 2008 • Starter line ~ 20 miles long • Serves West Mesa, North Tempe, and Central Phoenix • Important service stops • Arizona State University • Mill Avenue Shopping District • Professional Sports Facilities • Phoenix Sky Harbor Airport • Phoenix Central Business District
Network Development • Network adapted from 4-step model network • Centroid connectors deleted • All speeds and capacities set to physical values • External connectors retained • TRANSIMS built-in network conversion tool
Network Development • Transit network created from route stops and route characteristics • Route headways vary by service times • Routes coded with stops and “pass-by” points • Manual adjustments made to lane connectivity
Definition of Activity Locations • Activity locations (ALs) constitute the start and end point of every trip • Alternative to the zone centroid in the 4-step model • All activity locations are assigned a corresponding zone • Each zone must have at least 1 AL assigned to it • Developed a program to • Identify zones with no ALs • Locate the closest AL to that zone centroid • Reassign the AL found to the zone in question
O-D Trip Tables • Initial implementation was O-D trip table-based • Obtained from the 4-step model • Trip tables by mode: SOV, HOV, bus, express bus, light rail • Trips by purpose (6 purposes) • Time of day applied through diurnal distributions • Calculated from NHTS 2009 data • Distributions by mode and purpose • TRANSIMS trip conversion tool • ~15 million trips in Greater Phoenix Metro Area
Rail Bias • Found light rail boardingsbelow observed ridership numbers • Two possible transit options in TRANSIMS • “transit” or “transit with rail bias” • Found that coding all transit trips as “transit with rail bias” improved boarding counts • Rail bias is set higher than 1 • Prompts transit riders to prefer rail over bus
Execution of TRANSIMS • TRANSIMS Studio: GUI built to aid in TRANSIMS model building • TransVIS: visualization tool built for TRANSIMS • Currently running TRANSIMS Studio • 64 bit Windows machine • 6 processors = 6 traveler partitions • 1 full microsimulation takes about 2 days • Adding more processors could reduce run times
Router Stabilization • Iterative method • In each iteration, re-route only select travelers • Plan Sum finds travel times based on free-flow speed
Microsimulator • Process similar to that of Router stabilization • Microsimulator is used rather than Plan Sum • Microsimulator considers congestion along continuous time axis • Cellular automata model • Every travel lane is a series of cells • Only one vehicle can exist in a cell at a time • Microsimulator includes parameters for following distance, reaction time, look-ahead distance, etc.
Results based on O-D Tables • Total travel time for all trips = 5824751 hours • Average travel time = 30.08 minutes • Maximum vehicles on the network = 652159 at 3:49:51 pm • Time schedule problems still experienced • Departure time • Arrival time • Wait time
Light Rail Scenario • Selected two planned extensions • Northern extension • Mesa extension • All transit trips in the O-D tables still coded as “transit with rail bias” • Even with fixed demand, transit riders have a choice
Light Rail Scenario Results • Found expected increase in rail boardings • Also found increase in bus boardings • Could be due to a greater number of travelers taking advantage of transfer opportunities
Generating Synthetic Population • PopGen software used • Developed at ASU • Chosen for its flexibility • No learning curve for ASU researchers • Synthesis performed to generate2009 population • Synthetic Population Summary • Number of Household File Records = 1521189 • Average Persons per Household = 2.76 • Average Workers per Household = 1.32 • Average Vehicles per Household = 1.81
Synthetic Activity Generation • Used TRANSIMS built-in activity generator: ActGen • Inputs: • Synthetic population with household descriptions • Survey file with activities pursued by persons in varying household types • Output: • File containing daily activity schedules for every person in the population • Used synthetic population from PopGen • Input survey file created from NHTS 2009
Preparation of Input Survey Data • Trials made with different survey samples • Only Arizona survey records • 4511 survey records • 2.99 activities per person generated • 8.37 activities per household generated • All U.S. survey records • 136136 survey records • 4.52 activities per person generated • 12.83 activities per household generated • Used entire US survey records for richer sample from which to draw activity records
Preliminary Activity Generation Model • Activity-based travel simulation in the early stages at this time • All activities simulated for morning peak period • 6:00 to 9:00 AM • Model not yet validated
Ongoing Work • Initial results from activity generation simulation show an under-estimation of trips and transit boardings • Exploring possible ways to enhance replication of base year traffic volumes and boardings • Focus on ActGen module • Will apply the activity-based model to analyze two proposed light rail extensions
Questions http://simtravel.wikispaces.asu.edu
Results based Activity Files • Total travel time for all trips = 406944 hours • Average travel time = 50.53 minutes • Maximum vehicles on the network = 55774 at 8:45:31 am • Most common problems • Departure time • Transit Capacity