Download
1 / 14
140 likes | 262 Views
C rossover phenomenon in vehicle emissions with DFA. Wei Pan. College of Physical Science and Technology, Guangxi University, China. August 13, 2013. Plan. Introduction Data collection of vehicle emission Detrended Fluctuation Analysis (DFA) Crossover Phenomenon in vehicle emission

E N D
Crossover phenomenon in vehicle emissions with DFA Wei Pan College of Physical Science and Technology, Guangxi University, China. August 13, 2013
Plan • Introduction • Data collection of vehicle emission • Detrended Fluctuation Analysis (DFA) • Crossover Phenomenon in vehicle emission • Notes
Introduction The problem in the traffic flow: Why so stuck! http://auto.people.com.cn/GB/25959/98358/8362/11367000.html
The problem behind the traffic flow: Vehicle emissions oxygen gasoline http://sichuan.sina.com/news/sc-all/2011-06-04/259-43291.html
Cooperate with the City University of Hong Kong Data collection Place:Nathan Road, Mong Kok, Hong Kong Time : Rush hours ( 6:59:25~9:01:56 in the morning 16:52:31~18:16:12 in the afternoon ) Instrument : TSI model 982 Target : CO and CO2
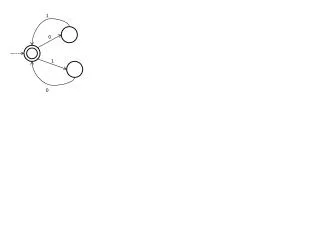
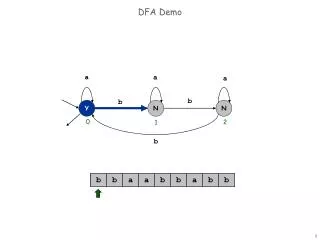
DFA Detrended fluctuation analysis (DFA), first proposed by Peng et al. in 1994 [Phys. Rev. E 49, 1685–1689] And now it becomes a scaling analysis method for detection of long-range correlations embedded in data sequence.
Integrate the time series is the length of the signal. Then divide the integrated signal where For a given box size , into boxes of equal length and fit them by using a polynomial function .
is no correlation is long-rang anticorrelation is long-rang correlation For different scales (box sizes ), we get
Crossover phenomenon DFA fluctuation function versus the scale in log-log plots
Notes • Statistical analysis suggests that the major concentration distributions of carbon emission have little change. • A crossover phenomenon has been found, which verifies the long-term dependence of carbon emission from vehicles.
References • Ritz, B., Yu F. 1999. “The Effect of Ambient Carbon Monoxide on Low Birth Weight among Children Born in Southern California between 1989 and 1993,” Environmental Health Perspectives, 107(1):17-25. • Peng , C. K., Buldyrev, S. V., Havlin, S., Simons, M., Stanley, H. E. and Goldberger, A.L. 1994. “Mosaic Organization of DNA Nucleotides,” Phys. Rev. E, 49(2):1685-1689. • K. Hu, P. Ch. Ivanov, Z. Chen, P. Carpena and H. E. Stanley. 2001. “Effect of Trends on Detrended Fluctuation Analysis.” Phys. Rev. E, 64(1):011114(19). • Sprott, J. C. 2004. “Chaos and Time-Series Analysis,” Oxford University Press, pp. 218-219. • N. K. Das, R. K. Bhandari, P. Sen and B. Sinha. 2009. “Scaling and Crossover Phenomena in Anomalous Helium Sequence,”arXiv:0906.0832.