Download
1 / 12
120 likes | 281 Views
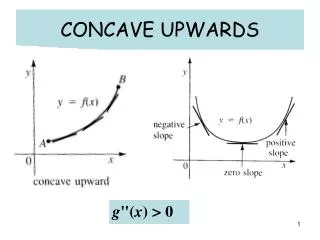
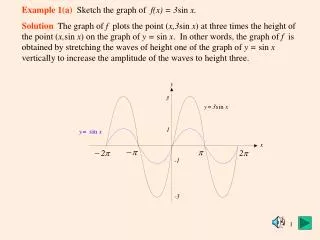
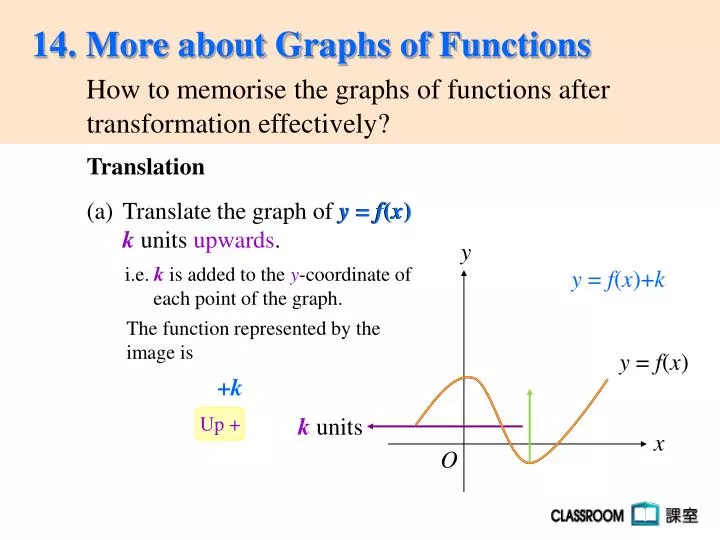
y. x. O. Translation. Translate the graph of y = f ( x ) k units upwards. y = f ( x ). i.e. k is added to the y -coordinate of each point of the graph. y = f ( x ) + k. The function represented by the image is. y = f ( x ). + k. Up +. k units. y. x. O.

E N D
y x O Translation • Translate the graph of y = f(x) • k units upwards. y = f(x) i.e. k is added to the y-coordinate of each point of the graph. y = f(x)+k The function represented by the image is y = f(x) +k Up + kunits
y x O Translation • Translate the graph of y = f(x) • k units downwards. y = f(x) i.e. k is subtracted from the y-coordinate of each point of the graph. y = f(x) The function represented by the image is y = f(x)-k -k Down - kunits
y x O Translation (c) Translate the graph of y = f(x) h units to the left. y = f(x) y = f(x) y = f(x+h) y1 = y2, x1 = x2+h ∵y1 = f(x1) ∴y2 = f(x2 +h) The function represented by the image is y = f(x ) +h (x2 , y2) (x1 , y1) Left + h units
y x O Translation (d) Translate the graph of y = f(x) h units to the right. y = f(x) y = f(x) y = f(x-h) y1 = y2, x1 = x2-h ∵y1 = f(x1) ∴y2 = f(x2-h) The function represented by the image is y = f(x ) -h (x2 , y2) (x1 , y1) Right - h units
y x O Reflection (a) Reflect the graph of y = f(x) in the x-axis. y = f(x) i.e. the sign of the y-coordinate of each point ofthe graph changes. y = f(x) The function represented by the image is - y = f(x) y = -f(x)
y x O Reflection (b) Reflect the graph of y = f(x) in the y-axis. y = f(x) i.e. the sign of the x-coordinate of each point of the graph changes. The function represented by the image is y = f(x) y = f(-x) - y = f(x)
y x O Dilation (a)Dilate the graph of y = f(x)vertically. y = f(x) (i) The graph is enlarged by k1 times vertically, where k1>1. y = k1f(x), k1>1 i.e. the y-coordinate of each point of the graph is multiplied by k1. The function represented by the image is y = f(x) k1 y = f(x)
y x O Dilation (a)Dilate the graph of y = f(x)vertically. y = f(x) (ii) The graph is contracted to k2 time vertically, where 0<k2<1. i.e. the y-coordinate of each point of the graph is multiplied by k2. y = k2f(x), 0<k2<1 The function represented by the image is y = f(x) k2 y = f(x)
1 (i) The graph is contracted to time horizontally, where k1>1. k1 y x O Dilation (b)Dilate the graph of y = f(x)horizontally. y = f(x) y1 = y2, x1 = k1x2 ∵y1 = f(x1) ∴y2 = f(k1x2) The function represented by the image is (x1 , y1) (x2 , y2) y =f( x) k1 y = f(x) y = f(k1x), k1>1
1 (ii) The graph is enlarged by times horizontally, where 0<k2<1. k2 y x O Dilation (b)Dilate the graph of y = f(x)horizontally. y = f(x) y1 = y2, x1 = k2x2 ∵y1 = f(x1) y = f(k2x), 0<k2<1 ∴y2 = f(k2x2) The function represented by the image is (x2 , y2) (x1 , y1) y =f( x) k2 y = f(x)
y x O Dilation (b)Dilate the graph of y = f(x)horizontally. The maximum (minimum) value remains unchanged. Enlargement y = f(k2x), 0<k2<1 y = f(x) y = f(k1x), k1>1 Contraction
Down - Up + Left + Right - 1 1 k k Transformation Easy MemoryTips: