Download
1 / 11
140 likes | 650 Views
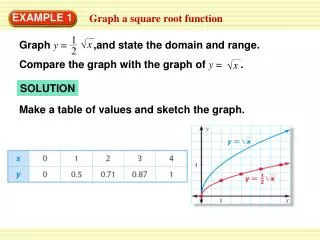
Graph: x + y = 5. 1. Solve for y. 3. Graph. 2. Make an X|Y chart. Graph: x – 3 = y. 1. Solve for y. 3. Graph. 2. Make an X|Y chart. Graph: y= 2x + 3. 1. Solve for y. 3. Graph. 2. Make an X|Y chart. Graph: 3x – 2y = 6. 1. Solve for y. 3. Graph. 2. Make an X|Y chart.

E N D
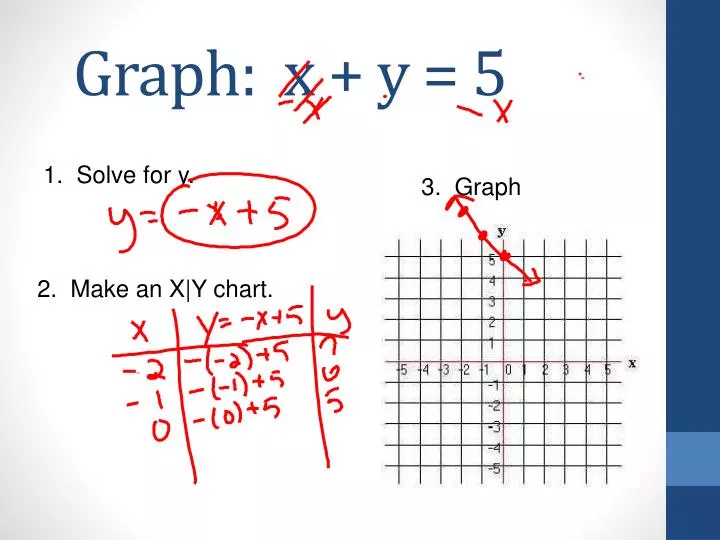
Graph: x + y = 5 1. Solve for y. 3. Graph 2. Make an X|Y chart.
Graph: x – 3 = y 1. Solve for y. 3. Graph 2. Make an X|Y chart.
Graph: y= 2x + 3 1. Solve for y. 3. Graph 2. Make an X|Y chart.
Graph: 3x – 2y = 6 1. Solve for y. 3. Graph 2. Make an X|Y chart.
Graph: x = 4 1. Solve for y. 3. Graph 2. Make an X|Y chart.
Graph: y = -3 1. Solve for y. 3. Graph 2. Make an X|Y chart.
You can check these on the graphing calculator. Press y = and type in the equation. Press Zoom Fit to look at equation. Press 2nd Graph (Table) to see the x|y chart.
Finding intercepts. X- intercept: set y = 0 Y- intercept: set x = 0 X-intercept: y-intercept: