Download
1 / 3
30 likes | 236 Views
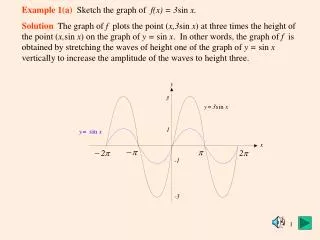
Example 1(a) Sketch the graph of f(x) = 3 sin x.

E N D
Example 1(a)Sketch the graph of f(x) =3sin x. SolutionThe graph of f plots the point (x,3sin x) at three times the height of the point (x,sin x) on the graph of y = sin x. In other words, the graph of f is obtained by stretching the waves of height one of the graph of y = sin x vertically to increase the amplitude of the waves to height three.
(b) Sketch the graph of g(x) = sin 4x. Solution The graph of g(x)=sin 4x is obtained by compressing the graph of y = sin x horizontally so that the waves occurs four times faster.
(c) Sketch the graph of h(x) = 3sin 4x. Solution The graph of h(x) = 3sin 4x is obtained from the graph of y = sin x by stretching the waves threefold vertically and compressing the waves fourfold horizontally. The graph of h combines the vertical threefold stretch of the graph of f(x) = 3sin x and the horizontal fourfold compression of the graph of g(x) = sin 4x.