Download
1 / 20
200 likes | 339 Views
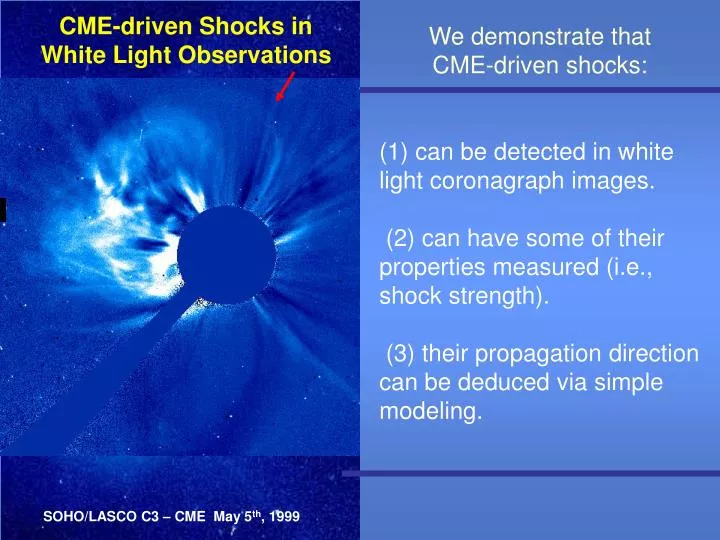
CME-driven Shocks in White Light Observations. We demonstrate that CME-driven shocks: (1) can be detected in white light coronagraph images. (2) can have some of their properties measured (i.e., shock strength). (3) their propagation direction can be deduced via simple modeling.

E N D
CME-driven Shocks in White Light Observations • We demonstrate that • CME-driven shocks: • (1) can be detected in white light coronagraph images. • (2) can have some of their properties measured (i.e., shock strength). • (3) their propagation direction can be deduced via simple modeling. CME-driven Shock SOHO/LASCO C3 – CME May 5th, 1999
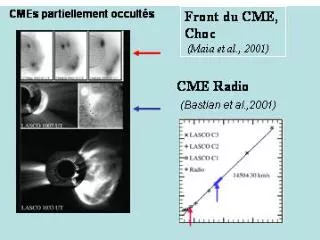
? How does a shock wave look like in a white light image? STREAMER DEFLECTION PILED UP MATERIAL Our Data Events between 1996-1999 The overall morphology of the white light corona is simple. ALL FAST CMEs V>1500 km/s Events that will be good candidates to drive a shock.
Quantifying Ontiveros & Vourlidas, 2008, ApJ Submitted
Quantifying G1 G2 G3 Image measurement Image measurement Image measurement ?
Results Kinetic Energy CC=0.7 Momentum CC=0.8 Speed high enough to create a shock, but not the best correlated parameter
Results WHERE IS EASIER TO OBSERVE THE SHOCK SIGNATURE? 15 degrees above or below the Solar Equator streamers make difficult the shock observation
Solar Corona Raytrace Simulated white light images for a bow-shock model observed through different lines of sight. (a) Along the Sun-Earth line (b) 10◦ west (c) 90 ◦ south (d) 45◦ west, 45◦south
Solar Corona Raytrace Comparison of Modeled Shock Orientation and CME Source Regions event shock nose source region 971106 S13W56 S18W63 980604 N47W138 N43W107 981126 S38W108 S26W134 Discrepancy latitude <12 deg longitude < 31 deg Ontiveros & Vourlidas, 2008, ApJ Submitted
Summary and Conclusions • 13/15 of these events exhibited a sharp but faint brightness enhancement ahead or at the flanks of the CME over a large area, which we interpret as the white light counterpart of the CME-driven shock. • All halo CMEs (10 events) have at least one location with such a shock signature. This is consistent with a shock draping all around the CME driver. • The clearest white light signatures were found 15degabove or below the solar equator, irrespective of heliocentric distance.
Summary and Conclusions • • We found only a weak dependence between the shock strength (γ) and the CME speed. • • We found stronger correlations between the density jump and the kinetic energy (cc=0.77) and between density jump and the momentum (cc=0.80). • • The observed density profiles are the result of line-of-sight integration through a thin shock and sheath and not with a step jump as the observed shocks from in-situ measurements. • We also found that our modeled 3D shock direction is in very good agreement with the expected direction of the CME assuming radial propagation from the source region.
Future Directions • Coronal Alfvén speed maps (w/ Riley) • Forward-model fitting of both CME (driver) and shock • Investigate spatial relation between shock/source region
Where? CME speed > alfven speed Necessary condition Not enough for WL images Alfven Speed 1-20 Rs MAS code (Riley, et al., 2006) 3D time-dependent MHD model SOHO/LASCO C3 – CME May 5th, 1999
EUVI Localizing the source of the CME COR2B COR2A Thernisien et al, work in progress