Download
1 / 21
220 likes | 338 Views
Complete characterization of a CME-driven shock from UV, white light and radio data. Alessandro Bemporad & Salvatore Mancuso INAF – Turin Astronomical Observatory. Outline. Introduction The March 22, 2002 CME Shock front: radio, white light and EUV signatures

E N D
Complete characterization of a CME-driven shock from UV, white light and radio data Alessandro Bemporad & Salvatore Mancuso INAF – Turin Astronomical Observatory
Outline • Introduction • The March 22, 2002 CME • Shock front: radio, white light and EUV signatures • Estimate of up-stream plasma parameters • Rankine-Hugoniot equations for oblique shock: • estimate of down-stream plasma parameters • Conclusions
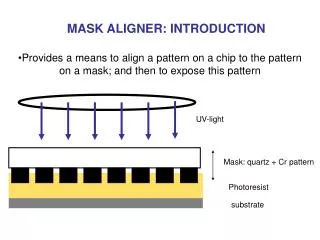
2fpe frequency fpe time Over the last 14 years observations of coronal shocks by the UV Coronagraph Spectrometer (UVCS) on SOHO provided both spatial resolution and unique diagnostics for the physical processes in coronal shocks. arcsec Coronal Mass Ejections observed by UVCS Coronal Mass Ejections are sporadic events where 1015-1016g of mass are launched into the Interplanetary Space at velocities ranging between ~ 500-2000 km/s. Fast CMEs drive fastshocksthat accelerate SEPs and electron beams (~10 keV) able to generate plasma waves at the local plasma frequency fpe that scatter off ions or combine to produce type II radio emission at fpe (fundamental) and 2fpe (harmonic). Metric type II radio bursts offer clear evidence of coronal shocks but: 1) no spatial resolution: direct imaging of coro-nal shocks remains in fact an outstanding observational challenge; 2) no direct information on physical properties of shocked plasma.
CME-driven shocks as seen in UV spectra shock front Broad wings in the O VI doublet (right) as results of a shock passage (left; from Mancuso et al. 2000, A&A ). The passage of a shockheats the emitting material and is detected as broad wings mainly in the non neutral ions. In the UVCS spectra the presence of a shock front is more likely dete-cted in the brightest spectral lines such as the O VI doublet and the H I Ly-aline, providing a direct diagnostic of the kinetic temperatures behind the shock. Detections of shocks in UV spectra have already been reported for four CMEs (Raymond et al. 2000; Mancuso et al. 2002; Raouafi et al. 2004; Ciaravella et al. 2005; Mancuso & Avetta 2008). None of these works made a determination of pre- and post-shock physical parameters of plasma
The March 22, 2002 event 11:06 11:30 11:54 coronal streamer UVCS slit LASCO/C2 images • CME start time ~ 10:30 UT • Fast CME (vLASCO cat = 1750 km/s) • Associated to: • - X-class flare - Strong radio burst • UVCS observations • FOV: slit centered at 4.1 Rʘ, lat = 70°SW • Time coverage: 00:55 – 18:29, • 200s exposures
In the following minutes a type-II radio burst is detected by the WIND spacecraft. As the shock expands, the streamer plasma density decreases with altitude, leading to the observed frequency driftwith time. → signature of the CME-driven shock Shock signature in Radio data 22/03/2002, 10:40 UT A few minutes after the CME start time a strong arch-shaped radio emission (164 MHz) appears above the limb. The radio emission is located just above the region where the plasma has been evacuated. At the same time interval a type-II signature has been detected from the Potsdam radiospectrometer CME source AR → possible early signature of the CME driven shock. EIT 195 CME Nancay Radioheliograph – 164 MHz
Shock front Shock front Shock front Shock signature in white light 2002/03/22, 11:06 2002/03/22, 11:30 2002/03/22, 11:54 Coronal streamer UVCS slit LASCO/C2 base difference images
Streamer deflection Streamer deflection Shock front Shock front Time (h) → Time (h) → Shock signature in UVCS spectra Pre-shock coronal streamer Pre-shock coronal streamer 11:30 Lya 1215Å: due to radiative excitation alone. Post-shock plasma accelerated & heated → Lya emission decreases (Doppler dimm.) O VI1032Å: due to both radiative and collisional excitations. Post-shock plasma compressed and accelerated → OVI radiative component Doppler dimmed, collisional component increased. O VI 1032Å intensity Lya 1215Å intensity Polar angle (°) Polar angle (°)
O VIl1031.9 O VIl1037.6 UVCS O VI line profiles • Post-shock plasma: • Tk~2 times larger than bgd corona • Tk fades back to coronal valuesin ~3h • These are only upper limits to the real Tk: • obs. broadening = • heating + LOS exp. • vLOS~ 120 km/s • vLOS fades in ~3h • Taking into account the shock velocity on the plane of the sky: • vPOS~ 1150 km/s • qCME ~ 6° toward the observer, mainly on the plane of the sky pre-shock Line of sight post-shock background corona
MHD-Rankine-Hugoniot equations for oblique shock These equations have in general up to 3 possible solutions for the compression ratio r = rd /ru. If we stay in the region of the plane [q(vu),q(Bu)] where r the has a unique solution: ? Rankine- Hugoniot eq. 1 Rankine- Hugoniot eq. 2 3 Estimate of Upstream parameters 1) Derive Tu, nu, vu from UVCS data; 2) Derive r, qvu from LASCO; 3) Assume a value for qBu Downstream parameters 1 Mass flux X-momentum Y-momentum Energy Maxwell’s eq. Maxwell’s eq.
downstream plasma I(Lya)u = 9.2 x10⁸ phot cm-2s-1sr-1 (interplanetary Ly-a subtracted) upstream plasma I(O VI)u = 7.6 x10⁶ phot cm-2s-1sr-1 Time (h) → Time (h) → Upstream parameters from UVCS data Lya 1215Å intensity vshock= 1150 km/s Shock front Polar angle (°) • Assume ne(r), Te(r), vout(r) profiles along the LOS (Cranmer 1999) • Vary densities and temperatures by introducing two costant multiplier (Kn and KTfor density and temperature,respectively); • Compute the expected I(Lya) and I(OVI) by iterating over all the possible values of (Kn, KT) pairs and integrating along the LOS; • Find the (Kn, KT) pair that better reproduces the observed intensities. Results: (Kn, KT) = (4.3, 0.37) → nu(POS)~ 9×104 cm-3 Tu(POS)~ 2×10⁵ K
Upstream parameters from LASCO/C2 data pre-shock white light Fraction k A = B = Compressed plasma post-shock white light LOS LOS L kA = B-A = R-H equations hold in the frame of reference at restwith the shock front 11:30 UVCS slit radial to the Sun shock front vwind~300 km/s Y (R๏) Y (R๏) vwind vshock= 1150 km/s vshock qvu~ 15° qBu~ 70° Bu║vwind vu~ 1080 km/s X (R๏) X (R๏) • Measure the pre- and post-shock WL • Assume a thickness L along the LOS for the involved coronal region → L = 0.53 R๏ (sherical shell: thickness d=104km, r=2.5 R๏) • Given L, estimate the fraction k • Estimate the compression ratio r as Result: r ~ 2.8
These results hold in the reference frame at rest with the shock surface. Hence, in the reference frame at rest with respect to the Sun: vwind(pre)~ 300 km/s vwind(post)~ 770 km/s vshock vshock Bu vwind(pre) qvd=22.4° qBu=70° qvu=70° qBd=74.0° vwind(post) Rankine- Hugoniot eq. Bd Downstream parameters vA(pre)~ 350 km/s > vwind(pre) → sub alfvènic flow (MAu = 0.85) vA(post)~ 260 km/s << vwind(post) → super-alfvènic flow (MAd = 2.94) b(pre) = 0.027 → b << 1 b(post) = 3.52 → b > 1
Summary • On March 22, 2002 a fast CME occurred, related to X-class flare and type-II radio burst. • It is possible to identify the transit of the shock front both in the LASCO/C2 and UVCS data. • From these data we derived an estimate for the upstream plasma parameters, but the magnetic field. • Given the upstream parameters and the compression ratio r from LASCO data, the R-H equations give the downstream parameters. • Results: the shock transit corresponds to 1) plasma compression (~2.8), 2)heating (by a factor ~70) and 3) transition from sub- to super-alfvenic flow and 4) from b<<1 to b>1.
Shock front Shock front Shock front Shock signature in white light Coronal streamer LASCO/C2 wavelet enhanced images
Magnetic field estimate Bemporad & Mancuso (2009)
Normalized post-shock profiles (coronal profile sutracted) Normalized coronal pre-shock profiles UVCS O VI line profiles • Post-shock profiles are: • broader than coro-nal profiles (broade-ning fades with time) • red-shifted (shifting fades with time)
Coronal shocks detected by UVCS/SOHO Raymond et al. (2000) Mancuso et al. (2002) Ciaravella et al. (2005) SEP ? East Limb NO SEP E W Proxy for SEPs West Limb SEP
June 11, 1998(Raymond et al. 2000) When the shock arrives at the UVCS slit - H I Lyman alpha intensity drops down - O VI lines develop broad wings - Si XII line intensities increase.
June 28, 2000(Ciaravella et al. 2005) O VI 1032 O VI 1037 18:59 UT 19:02 UT 19:05 UT
March 3, 2000(Mancuso et al. 2002) t = 02:21 UT t = 02:24 UT O VI 1032, 1037 A compression ratio of 1.8 was the only value consistent with both O VI and H I line widths