Download
1 / 26
260 likes | 375 Views
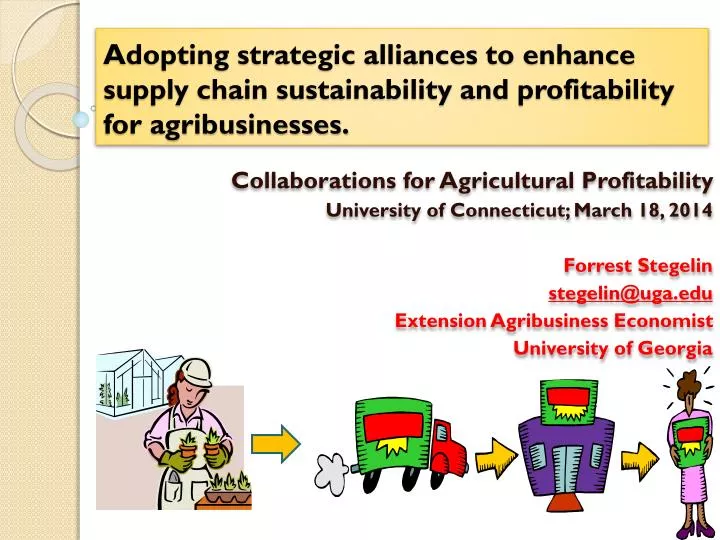
Adopting strategic alliances to enhance supply chain sustainability and profitability for agribusinesses. Collaborations for Agricultural Profitability University of Connecticut; March 18, 2014 Forrest Stegelin stegelin@uga.edu Extension Agribusiness Economist University of Georgia.

E N D
Adopting strategic alliances to enhance supply chain sustainability and profitability for agribusinesses. Collaborations for Agricultural Profitability University of Connecticut; March 18, 2014 Forrest Stegelin stegelin@uga.edu Extension Agribusiness Economist University of Georgia
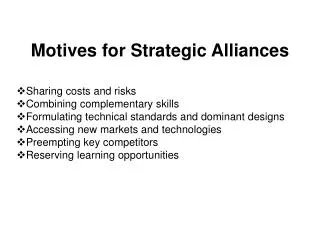
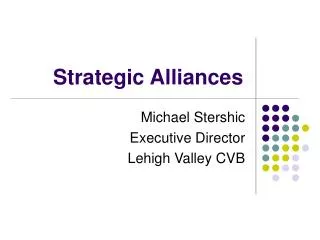
What is a strategic alliance? • A strategic alliance is a formal or informal arrangement/agreement involving at least two firms pursuing some common long term goals, and close coordination exists between the alliance partners. • A cooperative is a formal/legal association of member-owners operating a separate business that provides services (purchasing or farm supply, marketing, or production services) at cost to its patrons. • An agricultural bargaining association is a group of producers of a common good/commodity formally organized to gain greater power in the market for its members to increase the farmer-members’ incomes, requiring recognition by buyers the bargaining association as primary source of product.
Example of a strategic alliance in action. • Costs of transporting environmental plant material and harvested produce to market and of the acquisition of relevant production inputs are of concern to Georgia food and environmental horticulturalists; transportation costs rose 21% in past 5 years, and now account for >10% of total cost of production. • Economic, social and climatic factors also hurt the food and environmental horticulture crops producers in Georgia (two droughts, recession, changing consumer demographics and psychographics). • Georgia lost 45% of production capacity, 35% of marketing capacity, and 30% of input supply availability.
Survival and growth strategies. • For those grower operations remaining, how do they stop the economic hemorrhaging and even re-grow their businesses? • For the small to mid-sized growing operations, distribution/shipping costs showed greatest disparity, variability, and rate of increase (fuel/energy). • Shipments or deliveries of inputs being made from same sources to neighboring nurseries at same times. • Producers making deliveries to common buyers (sharing clients) at about same time over common routing, duplicating ownership and variable transportation costs, driver expenses and time, etc. • Each operation owned an independent distribution system that was not fully utilized – inefficient, poor economics and management decision making.
Issues compounded by “buy local, sell local.” • With the state and federal-sponsored “buy- local”[Georgia Grown, KYF2, food hubs] emphasis to buyers, “sell- local” puts expectation on small to mid-sized operations to deliver to local market venues. • Logistical cooperation becomes an important strategic alternative to reduce costs (input acquisition, distribution/marketing, and service provision – the supply chain) and increase efficiency in the horticulture sector. • Transportation/distribution/shipping costs account for over 10% of farm-gate or wholesale value of Georgia’s environmental horticulture industry, and account for over 15% of fuel/energy use within produce industry.
Development of a transportation strategic alliance in Georgia. • Among factors affecting expansion, topics of production, marketing, personnel and transportation considered most relevant (Hodges/Haydu); transportation ranked higher than debt or equity capital and marketing, but below personnel and production (Brooker et al). • Objectives of strategic alliance study were to determine if a transportation alliance (a formal or informal arrangement involving at least two firms pursuing some common long term goals and close coordination between the alliance partners) would reduce shipping costs and increase distribution efficiency and profitability among producers/suppliers in Georgia who are selling “local” – supply chain management. • Secondary objective focused on sustainability - to see effect on carbon footprint. Also desire to conduct sensitivity analysis, including central distribution versus dispersed locations.
What is a supply chain? • A supply chain encompasses all activities associated with the flow and transformation of goods from the raw materials stage (extraction), through to the end user, as well as the associated information flows. • Material and information flow both up and down the supply chain. • For an individual firm, supply chain includes both its upstream supplier network (including inputs) and its downstream distribution channel – a series of linked suppliers and customers. For an industry, such as the “green industry,” focus is on supply chain relationships and organizational dynamics.
Integrated supply chain model. Customers Information and financial flows Retailers Product and material flows Distribution Centers Strategic business unit Assembly/Production/Manufacturing 1st Tier Suppliers1st Tier Suppliers 2nd Tier Suppliers 2nd Tier Suppliers 2nd Tier Suppliers Provide end customers and supply chain member organizations with the materials required/requested, in the proper quantities, in the desired form, with the appropriate documentation, at the desired location, at the right time, and at the lowest possible cost.
The basic green industry crop supply chain: inputs production customer Aggregation Fabrication Manufacturing Distribution of Components or Assembly and Packaging or Marketing Input Supply Chain
Planting or Growing Harvesting Storage Distribution Potting from in Field, for Market & Shipping & Sales Seed or Stock Container, Greenhouse Producer/Grower Supply Chain Activities
Distribution Marketing Customer Ancillary Services Customer Supply Chain
The strategic alliance. • Collection of data from collaborators to develop a simple unit cost allocation model that is adaptable and useable with the GIS software ArcLogistics 9.3. • Although study seemed to have buy-in from growers, concerns still arose: • What’s in it for me? Proof? Loss of independence. • Reluctance to provide logistics, marketing and sales information • Tell me again what is an alliance (and don’t tell me it’s a camouflaged term for cooperative) • Survey design and adequate sample size • Format and availability of data • Lack of commonalities among growers (facilities, vehicles, customers and their locations, product specifications, shipping containers, delivery dates and times, driver efficiency, etc.) • Managerial relevance of using averages in conducting a sensitivity analysis.
The spatial equilibrium model. • Using the GIS software ArcLogistics 9.3, inventory data and asset information were collected to develop a simple unit cost allocation model that generated a sensitivity analysis to determine logical clusters or alliances, possible order sharing routings, numbers of orders per shipping cycle, and vehicle requirements. • While cost is a critical factor in the shipping design, time-based competition to bring product to market in the right quantity, at the right place and right time made reliability a key consideration. • Fluctuations in demand, driver issues, maintaining appropriate temperatures and ventilation, employee training and turnover, and proper loading and handling are additional challenges.
Results and implications for environmental horticulture. • Five transportation alliances have been established among small to mid-sized greenhouse (floriculture) and container nurseries (annuals and perennials). • Net results for these alliances and participating firms: • 12% average annual total cost savings to the alliance (participating firms) operations; • 23% average annual total miles driven savings; • 18% average annual ownership savings in vehicles owned; • 31% average annual savings in hours of driving time and driver labor; • 19% overall (system-wide) reduction in total carbon dioxide equivalents (CO2e) emissions reducing the carbon footprint (but not reaching carbon neutrality) – the sustainability issue.
Net savings results for produce or fruit and vegetable sector. • Compared to a companion fruit and vegetable growers study, these savings for the environmental horticulture producers were higher due to virtually unlimited seasonality of distribution (nearly year-round for container and greenhouse growers) versus • shipping season of shortly after last frost in spring for cool season leafy crops to first frost/freeze in fall for fruit and vegetable producers.
What is sustainability? Definition of sustainability goes beyond the concern of going “green” (environmental impact), or being organic, natural, carbon neutral, environmentally friendly, reducing greenhouse gas emissions, minimizing global warming, reducing carbon contribution, etc. • Three components – economics/profitability, societal or community well-being, and environmental quality. • Challenges to developing a business case for sustainability: • Forecasting and calculating benefits and costs, and planning beyond the 1-5 year time horizon typical of most investment frameworks; • Gauging the system-wide effects of sustainability investments in a life cycle assessment – a requirement for “sustainable”.
What is a life cycle assessment? • “… a tool to evaluate the environmental consequences of a product or activity holistically across its entire life.” [US EPA] • System-oriented because it attempts to integrate environmental requirements into each stage of the development and operations/maintenance process so that total impacts caused by the entire system can be reduced. • An LCA normally follows 3 distinct steps: • An inventory analysis that identifies materials and energy resources and their flow patterns; • Animpact analysis of qualitative and quantitative assessments of the consequences to the environment; • An improvement analysis that contemplates actions that can be taken to improve upon current conditions. Most Difficult
Goal is carbon neutrality. • Event or Carbon Carbon Net Annual Activity Contribution Sequestered Carbon ……… MT CO2e/year • The good news for the food and environmental horticultural sectors is that vegetation is treated as acarbon sink(carbon sequestered), while other inventory items (structures, labor, equipment) are sources of greenhouse gas (GHG) emissions and carbon contributions, so the food and environmental horticulture sectors, including turf and sports fields, are relatively more carbon neutral than bricks and mortar or bricks and clicks businesses.
Calculations of LCA for three strategic transportation alliances in Georgia. Alliance C Contribution C Sequestered Net Carbon MT CO2e/year North 2,173 1,570 603 Central 1,733 1,025 708 South 2,436 1,061 1,375 If the strategic alliance had net annual carbon of slightly above carbon neutrality, then management strategy adjustments could be made, without knowingly reducing product quality. Adjustmentsmight include switching from petroleum diesel and electricity to biodiesel and alternative renewable energy (solar), or reducing the amount of municipal water used for irrigation, washing, hydro-cooling or by implementing better production, preparation, packaging, and cold storage management regimes.
How to adopt strategic alliances to enhance food and environmental horticulture supply chain sustainability and profitability? • Using the Georgia situation as an example, strategic transportation allianceswere implemented among container and greenhouse crops producers and produce (fruit and vegetable crops) growers and marketers with the hypothesis that the alliances would reduce shipping costs and increase distribution efficiency among small to mid-sized operations who were selling local to common marketing venues, purchasing inputs from common sources, and that the collaborating firms would reduce their overall carbon footprint. • Yes, but! Back to the data and enlisting collaborators?!
Concerns arise with the establishment of each strategic alliance – need buy-in among collaborators: • What’s in it for me? Show me the money! Loss of independence. • Reluctance to provide logistics, marketing and sales information (#s or $s) • Tell me again what is an alliance (and don’t tell me it’s a camouflaged term for cooperative) • Survey design and adequate sample size considerations • Format and availability of data; need for computer skills • Lack of commonalities among growers (facilities, vehicles, customers and their locations, product specifications, shipping containers, delivery dates and times, driver efficiency, etc.) • Managerial relevance of using averages in conducting a sensitivity analysis.
Thank you for your time and attention.Any questions, comments, suggestions?