Download
1 / 25
270 likes | 468 Views
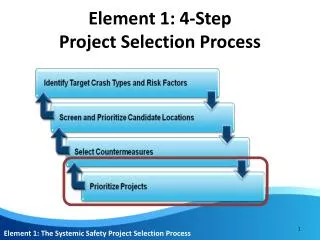
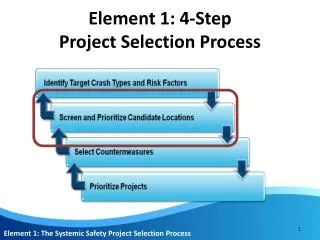
Project Selection Process. Recognize. Define. Launch. Six Sigma Executive Series. Management. Project Identification and Launch (support given from “Belt”). Recognize. Define. Management. Management owns 80% of the responsibility here. Measure. “Belt”. Analyze.

E N D
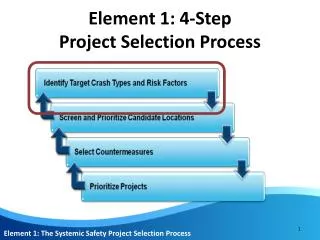
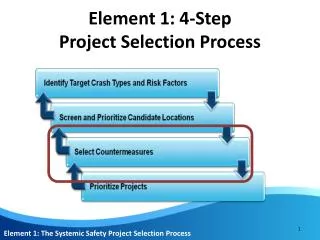
Project Selection Process Recognize Define Launch Six Sigma Executive Series
Management Project Identification and Launch (support given from “Belt”). Recognize Define Management Management owns 80% of the responsibility here. Measure “Belt” Analyze Finding the solution of Y = f(X) “Belt” Solution to the problem and a Final Report (support given from a Champion). Improve “Belt” Control “Belt” Implement solution and maintain ongoing benefits (support given from “Belt”). Realize Management The Project Roadmap
Generally a systemic or chronic problem which is impacting the success of a process or function. Practical Problem • Characteristics of a • Project • Has a financial impact to Earnings or a significant strategic value • The problem is not easily or quickly solvable using traditional methods • It is targeted to reduce the problem by >70% over existing performance levels A well defined effort that states the problem in quantifiable terms with known expectations. Six Sigma Project Data oriented problem that is addressed with facts and data analysis methods. Statistical Problem Data driven solution with known confidence/risk levels versus an “I think” solution. Finding the solution of Y = f(X) + e Statistical Solution • Focus is to solve a business problem that is: • Affecting the success of the organization • Affecting costs • Affecting employee satisfaction • Impacting a Customer (external and/or internal) A method of assuring the long-term sustainability of the fix to the problem. Control Plan The solution is not complex, expensive or irrational and is readily implement-able. Practical Solution Tangible results measurable in metrics with quantifiable financial or strategic value. Results The Six Sigma Project
Project Difficulty Distribution Solving “Fruit on the Ground,” “Logic & Intuition” Type Problems – Yellow and Green Belt. Solving “Process Optimization” “Complex Interaction” “Process Entitlement” Black and Master Black Belt Projects. Solving“World Hunger,” “Boil the Ocean” Type Problems. Quantity of Problems Six Sigma Projects Too Hard - Are Usually Management or Market Caused Too Easy Difficulty and Cost of Problems
The Following People Typically Identify Potential Projects: Champions “Belts” Process Leaders Functional Managers/Process Owners Project Originators Any Employee Can Suggest a Project and Should Be Encouraged To Do So……However, It Should Be Considered and Sponsored by One of the Above People
The most common mistakes in defining a potential project are: Scope is too broad (solving world hunger or boiling the ocean). Symptoms include: too many output Y’s, multiple goals, numerous Process Owners, multiple departments. Solution: Divide problem into several projects. Problem is too easy. Problem solution is known. It is a “just do it”; no problem analysis required. Problem is a management or market issue – not a good “Belt” project. Long term research or development project, not a problem to be solved with Six Sigma tools. Common Mistakes in Defining Projects
Facts about Project Selection: Project Recognition & Definition are critical activities to the success of any project and to the Six Sigma improvement effort. Project Recognition & Definition are among the more important tasks a Champion performs. “When I seek a project, it usually stinks. But when the projects find me, they’re usually very good projects.” Six Sigma Black Belt International Truck & Engine Importance of Selection Process
RECOGNIZE PHASE Finding Areas Needing Improvement “Writing the Business Case” Recognize
Step 1 Creating Logical Grouping Finding Problematic Areas of Using Affinity Diagramming the Business Opportunity Opportunity Receivables Receivables Warranty Warranty Cycle time Cycle time Defects Defects Structure of the Business Case Structure of the Business Case As a company, our As a company, our __________ __________ performance for the performance for the Definition Definition Structure of the Business Case Structure of the Business Case ___________ ___________ area is not meeting area is not meeting __________. __________. Overall this is Overall this is As a company, our As a company, our __________ __________ performance for the performance for the causing causing ____________ ____________ problems which are costing us a problems which are costing us a Structure of the Business Case Structure of the Business Case ___________ ___________ area is not meeting area is not meeting __________. __________. Overall this is Overall this is As a company, our As a company, our accounts receivables accounts receivables As a company, our As a company, our accounts receivables accounts receivables As a company, our As a company, our accounts receivables accounts receivables As a company, our As a company, our accounts receivables accounts receivables performance for the performance for the finance invoicing finance invoicing area area performance for the performance for the finance invoicing finance invoicing area area performance for the performance for the finance invoicing finance invoicing area area performance for the performance for the finance invoicing finance invoicing area area much as much as $_______ $_______ per per ______. ______. is not meeting is not meeting the goal of 47 DSO the goal of 47 DSO . Overall . Overall is not meeting is not meeting the goal of 47 DSO the goal of 47 DSO . Overall . Overall is not meeting is not meeting the goal of 47 DSO the goal of 47 DSO . Overall . Overall is not meeting is not meeting the goal of 47 DSO the goal of 47 DSO . Overall . Overall As a company, our As a company, our __________ __________ performance for the performance for the this is causing this is causing cash flow and budget cash flow and budget this is causing this is causing cash flow and budget cash flow and budget this is causing this is causing cash flow and budget cash flow and budget this is causing this is causing cash flow and budget cash flow and budget Structure of the Business Case Structure of the Business Case causing causing ____________ ____________ problems which are costing us a problems which are costing us a problems which are costing us as much as problems which are costing us as much as problems which are costing us as much as problems which are costing us as much as problems which are costing us as much as problems which are costing us as much as problems which are costing us as much as problems which are costing us as much as $4M $4M per per year year . . $4M $4M per per year year . . $4M $4M per per year year . . $4M $4M per per year year . . ___________ ___________ area is not meeting area is not meeting __________. __________. Overall this is Overall this is much as much as $_______ $_______ per per ______. ______. As a company, our As a company, our __________ __________ performance for the performance for the As a company, our As a company, our accounts receivables accounts receivables As a company, our As a company, our accounts receivables accounts receivables As a company, our As a company, our accounts receivables accounts receivables As a company, our As a company, our accounts receivables accounts receivables Enabling Processes Enabling Processes Enabling Processes Enabling Processes Enabling Processes Enabling Processes Core Processes Core Processes Core Processes Core Processes Core Processes Core Processes causing causing ____________ ____________ problems which are costing us a problems which are costing us a performance for the performance for the finance invoicing finance invoicing area area performance for the performance for the finance invoicing finance invoicing area area performance for the performance for the finance invoicing finance invoicing area area performance for the performance for the finance invoicing finance invoicing area area Examples Examples is not meeting is not meeting the goal of 47 DSO the goal of 47 DSO . Overall . Overall is not meeting is not meeting the goal of 47 DSO the goal of 47 DSO . Overall . Overall is not meeting is not meeting the goal of 47 DSO the goal of 47 DSO . Overall . Overall is not meeting is not meeting the goal of 47 DSO the goal of 47 DSO . Overall . Overall ___________ ___________ area is not meeting area is not meeting __________. __________. Overall this is Overall this is this is causing this is causing cash flow and budget cash flow and budget this is causing this is causing cash flow and budget cash flow and budget this is causing this is causing cash flow and budget cash flow and budget this is causing this is causing cash flow and budget cash flow and budget problems which are costing us as much as problems which are costing us as much as problems which are costing us as much as problems which are costing us as much as problems which are costing us as much as problems which are costing us as much as problems which are costing us as much as problems which are costing us as much as much as much as $_______ $_______ per per ______. ______. $4M $4M per per year year . . $4M $4M per per year year . . $4M $4M per per year year . . $4M $4M per per year year . . 1. As a company, our 1. As a company, our accounts receivables accounts receivables performance for the performance for the causing causing ____________ ____________ problems which are costing us a problems which are costing us a Examples Examples As a company, our As a company, our accounts receivables accounts receivables As a company, our As a company, our accounts receivables accounts receivables As a company, our As a company, our accounts receivables accounts receivables As a company, our As a company, our accounts receivables accounts receivables finance invoicing finance invoicing area is not meeting area is not meeting the goal of 47 DSO the goal of 47 DSO . . performance for the performance for the finance invoicing finance invoicing area area performance for the performance for the finance invoicing finance invoicing area area performance for the performance for the finance invoicing finance invoicing area area performance for the performance for the finance invoicing finance invoicing area area much as much as $_______ $_______ per per ______. ______. is not meeting is not meeting the goal of 47 DSO the goal of 47 DSO . Overall . Overall is not meeting is not meeting the goal of 47 DSO the goal of 47 DSO . Overall . Overall is not meeting is not meeting the goal of 47 DSO the goal of 47 DSO . Overall . Overall is not meeting is not meeting the goal of 47 DSO the goal of 47 DSO . Overall . Overall 1. As a company, our 1. As a company, our accounts receivables accounts receivables performance for the performance for the this is causing this is causing cash flow and budget cash flow and budget this is causing this is causing cash flow and budget cash flow and budget this is causing this is causing cash flow and budget cash flow and budget this is causing this is causing cash flow and budget cash flow and budget problems which are costing us as much as problems which are costing us as much as problems which are costing us as much as problems which are costing us as much as problems which are costing us as much as problems which are costing us as much as problems which are costing us as much as problems which are costing us as much as Overall this is causing Overall this is causing cash flow and budget cash flow and budget problems which problems which Examples Examples $4M $4M per per year year . . $4M $4M per per year year . . $4M $4M per per year year . . $4M $4M per per year year . . finance invoicing finance invoicing area is not meeting area is not meeting the goal of 47 DSO the goal of 47 DSO . . are costing us as much as are costing us as much as $4M $4M per per year year . . 1. As a company, our 1. As a company, our accounts receivables accounts receivables performance for the performance for the As a company, our As a company, our accounts receivables accounts receivables As a company, our As a company, our accounts receivables accounts receivables As a company, our As a company, our accounts receivables accounts receivables performance for the performance for the finance invoicing finance invoicing area area performance for the performance for the finance invoicing finance invoicing area area performance for the performance for the finance invoicing finance invoicing area area Overall this is causing Overall this is causing Examples Examples cash flow and budget cash flow and budget problems which problems which is not meeting is not meeting the goal of 47 DSO the goal of 47 DSO . Overall . Overall is not meeting is not meeting the goal of 47 DSO the goal of 47 DSO . Overall . Overall is not meeting is not meeting the goal of 47 DSO the goal of 47 DSO . Overall . Overall this is causing this is causing cash flow and budget cash flow and budget this is causing this is causing cash flow and budget cash flow and budget this is causing this is causing cash flow and budget cash flow and budget finance invoicing finance invoicing area is not meeting area is not meeting the goal of 47 DSO the goal of 47 DSO . . problems which are costing us as much as problems which are costing us as much as problems which are costing us as much as problems which are costing us as much as problems which are costing us as much as problems which are costing us as much as $4M $4M per per year year . . $4M $4M per per year year . . $4M $4M per per year year . . are costing us as much as are costing us as much as $4M $4M per per year year . . 1. As a company, our 1. As a company, our accounts receivables accounts receivables performance for the performance for the Overall this is causing Overall this is causing cash flow and budget cash flow and budget problems which problems which As a company, our As a company, our accounts receivables accounts receivables As a company, our As a company, our accounts receivables accounts receivables finance invoicing finance invoicing area is not meeting area is not meeting the goal of 47 DSO the goal of 47 DSO . . performance for the performance for the finance invoicing finance invoicing area area performance for the performance for the finance invoicing finance invoicing area area are costing us as much as are costing us as much as $4M $4M per per year year . . is not meeting is not meeting the goal of 47 DSO the goal of 47 DSO . Overall . Overall is not meeting is not meeting the goal of 47 DSO the goal of 47 DSO . Overall . Overall this is causing this is causing cash flow and budget cash flow and budget this is causing this is causing cash flow and budget cash flow and budget problems which are costing us as much as problems which are costing us as much as problems which are costing us as much as problems which are costing us as much as Overall this is causing Overall this is causing cash flow and budget cash flow and budget problems which problems which $4M $4M per per year year . . $4M $4M per per year year . . are costing us as much as are costing us as much as $4M $4M per per year year . . As a company, our As a company, our accounts receivables accounts receivables performance for the performance for the finance invoicing finance invoicing area area is not meeting is not meeting the goal of 47 DSO the goal of 47 DSO . Overall . Overall this is causing this is causing cash flow and budget cash flow and budget problems which are costing us as much as problems which are costing us as much as $4M $4M per per year year . . Strategic Strategic Improvement Plan Improvement Plan Business Opportunity Analysis Summary Statement of Work Problem Statement Problem Statement Recruiting time for Production Planners is missing the goa Recruiting time for Production Planners is missing the goa l 81% of l 81% of the time. The average time to fill a request is 155 days in the the time. The average time to fill a request is 155 days in the Human Resources employee recruitment process over the past 15 Human Resources employee recruitment process over the past 15 months. This is costing us $145,000 per year of additional labor months. This is costing us $145,000 per year of additional labor and and rework costs. rework costs. Objective Statement Objective Statement Reduce the overall personnel recruiting time from an average Reduce the overall personnel recruiting time from an average Opportunity Opportunity • • of 155 days to 75 days, with an upper limit of 110 days. This of 155 days to 75 days, with an upper limit of 110 days. This will meet the current maximum goal of 100 days greater will meet the current maximum goal of 100 days greater than 95% of the time. The new goal which will be achieved than 95% of the time. The new goal which will be achieved Identification Identification by June 1, 2002, will support our Employer of Choice goal by June 1, 2002, will support our Employer of Choice goal and achieve a savings of $145,000. and achieve a savings of $145,000. Issues and Problems Issues and Problems • • Financial Priority Business Case Owner Impact Sponsor Matrix Matrix As a company, our accounts receivables performance for the finance invoicing area is not meeting the goal of 47 DSO. Overall this is causing cash flow and budget Scope Scope problems which are costing us as much as $4M per • • 1 Bob Smith $4M Ellen West year. As a company our product recall performance for the ice cream market area is not meeting the budget of Statement of Work Statement of Work • • 1.5%. Overall this is causing logistics, materials and cost problems which are costing us as much as $2M per 2 year. Mary Jones $2M Bill Jones As a company our final process yield performance for Prioritized Business Prioritized Business • • the culture area is not meeting the targeted 88% yield. Overall this is causing Floor space, shipment and resource problems which are costing us as much as $900K per year. Improvement Plan Improvement Plan 3 Ken Parks $900K Kathy Shank As a company our shipping logistics performance for the Smith’s market segment is not meeting the scheduling and cost requirements. Overall this is causing delivery issues and customer dissatisfaction problems which are costing us as much as $3M in lost revenues and $1.5M 4 Jill Williams $1.5M Earl Johnson in expenses per year. Opportunity Definition
Finding Areas Needing Improvement RECOGNIZE Starts With the Highest Level View and Moves Downward Into More Specifics to Formulate Six Sigma Projects • Start by assessing the higher level needs of the company; using any knowledge obtained from the Voice of the Customer (VOC) and/or the Voice of the Business (VOB). • Identify gaps in achieving the higher level needs of the company, the critical success factors or key goals and objectives of the company. • Achieving these goals should deliver customer satisfaction and business results • Business areas or processes which are impacting your goals are identified • Six Sigma projects are then selected with the goal of substantially improving these key processes • Select those areas or functions of the business related to the gaps which are performing poorly based on expectations, competitive knowledge or known deficiencies in performance. • Problems at this level usually are related to quality, cost or delivery
Finding Areas Needing Improvement • Problem “themes” will then become visible, such as: • Product returns/warranty costs • Customer complaints • Accounts receivable and invoicing issues • Cycle time/responsiveness • Inefficiencies of defective services • Yield and subsequent rework or scrap • Capacity constraints • Inventory levels You have now recognized where problems exist which need to be resolved in order to achieve our objectives.
Finding Areas Needing Improvement • Writing a Business Case identifies the problem area, a description/characterization of the high level problem and an estimate of the financial benefit if solved to expectations. • When doing this the intent is not to define a Six Sigma project but to identify a problematic area. • The description of the high level business problem does not have to be very detailed. The details come when defining the project(s) to resolve the Business Case. It can be as simple as: • Warranty returns are excessive • Accounts receivables are higher than target • Product test yield and cost is not competitive • Sales order responsiveness is causing customer complaints • The potential financial benefit is our current best estimate given the data/knowledge we have. “Just get the number in the ballpark.”
At the corporate level, the Opportunity Analysis Summary becomes a high-level road map for the Business Process Improvement Program. It identifies, with some specificity, which areas of the business and which metrics are to be improved and what impact such improvement will have. It serves, then, as a tool to assure subsequent project selection criteria remain focused on issues pertinent to the corporate objectives. As management, you want projects to improve metrics relevant to the corporate strategy. Using the Opportunity Analysis Summary as a first-level qualifier for project selection keeps the program focused on that which is important to the business. For those just beginning a Six Sigma or Business Improvement Program, it is also used to develop a training program. The complexity of the issues identified dictates the training mix of Champion, Black, Green and Yellow Belts. The time frame in which the issues will be addressed as desired by Management dictates the quantity of each. Opportunity Analysis Summary
Problematic Areas Finding Problematic Areas of the Business • It begins by writing a Problem Statement which identifies: • A problem area. • A description/characterization summary. • An estimate of the financial benefit if solved to expectations. • When doing this, your intent is not to define a project, but to identify a problematic area which may later become an improvement project. • The description of the business problem does not have to be overly detailed at this stage. The details come when defining the project(s) to resolve it. • The potential financial benefit is your current best estimate given the data/knowledge you have. “Just get the number in the ballpark.”
Six Sigma Business Assessment Writer • Instructions: • Capture Business Cases for the entire business – not just your area. • Complete each Business Case with your best estimate of the data. • Continue writing Business Cases until you have exhausted all known problematic areas. • Cut each Business Case into a separate paper strip. • Tape each cut Business Case to the designated area of the wall. • After all students have completed the Business Case writer, the instructor will provide directions to perform an Affinity Diagram.
Structure of the Problem Statement As a company, we are experiencing a problem with:. Theareawhere this problem is occurring is: . The problem has existed for at least:. The magnitude of the problem is: and the expected performance is: . The effect this problem is having on our business is: . This is costing us a much as$per. Writing the Problem Statement
Writing the Problem Statement Good Problem Statement Examples As a company, we are experiencing a problem with:Employee Turnover.The area where this problem is occurring is: All Stores. The problem has existed for at least: 2 years. The magnitude of the problem is: currently 88%, and the expected performance is: < 85%. The effect this problem is having on our business is: increased hiring and training costs and a lower than desired level of customer service. This is costing us a much as$400K in costs and $500K in Revenueper Year. As a company, we are experiencing a problem with:Credit Processing Equipment Uptime. The area where this problem is occurring is: All Stores. The problem has existed for at least: one year. The magnitude of the problem is: Uptime at 91%, and the expected performance is: >95% Uptime. The effect this problem is having on our business is: Service Turnaround Time and Lost Sales. This is costing us a much as$300Kper Year.
Good Problem Statement Examples As a company, we are experiencing a problem with:Merchandise Shortages. The area where this problem is occurring is: Various Stores. The problem has existed for at least: 180 days. The magnitude of the problem is: unknown, and the expected performance is: No Shortages. The effect this problem is having on our business is: Lost Sales & Expedited Delivery Costs This is costing us a much as$25Kper Month. Asa company, we are experiencing a problem with:Open Maintenance Calls. The area where this problem is occurring is: Companywide. The problem has existed for at least: 2 Years. The magnitude of the problem is: average of 1.6 OMC per store, the expected performance is: <1.2 OPC per store. The effect this problem is having on our business is: systems inoperative causing lost sales. This is costing us a much as$35K and per Month. Writing the Problem Statement
Writing the Problem Statement POOR PROBLEM STATEMENT: As a company, we are experiencing a problem with: employee turnover. The area where this problem is occurring is: in all stores. The problem has existed for at least: always. The magnitude of the problem is: really bad, the expected performance is: no turnover. The effect this problem is having on our business is: high hiring & training costs . This is costing us a much as a lot of money per month.. A POOR Problem Statement is ambiguous and subjective. It does not quantify the metrics descriptive of the challenge. While accuracy is not expected at this point, good guess-timates are necessary.
Problem Statement Instructions • Capture ideas for the entire business – not just your area. • Complete each with your best estimate of the data. • Continue writing until you’ve exhausted all known problematic areas. • Provide completed sheets of to the Facilitator. • Facilitator will tape each to the designated area of the wall. • After all participants have completed these steps, the instructor will provide directions to perform an Affinity Diagram.
Allows an effective gathering and grouping of ideas Allows a team to creatively generate a large number of ideas / issues and then organize and summarize natural groupings among them to understand the essence of a problem and breakthrough solutions. Overcome “team paralysis” Encourages creativity by everyone on the team at all phases Gain quick team consensus Typically has 40 - 60 items---not unusual to generate over 100 Problem Statements Affinity Diagrams for Opportunity Analysis becomes
1 2 4 5 3 Form a Team Describe the Issue Generate Ideas Tack Post-its to a Wall Sort Into Groups Affinity Diagram Steps
Affinity Diagram Steps 8 10 6 7 9 Create Header Cards Add Additional Info Load into Excel Take Action Sort into a Usable Format OK, start affinitying!!
Organizing the Knowledge Upon finalization of the Business Opportunity Analysis groupings, the information is entered into the Opportunity Analysis Matrix. This becomes a high-level road map to Project Selection. • Headings: • Project No. • Function • Function Owner • Problem/Opportunity • Dept./Division • Problem Owner • Expectation • Impact • Financial Impact • Project in Process • Key Goal/Objective