Download
1 / 25
250 likes | 273 Views
Hypothesis Testing 2 Samples. (Chapter - 04/D). Parameters of two samples are different. sample-A. sample-A. sample-B. sample-B. population-II. population-II. population-I. Parameters of two samples are not different. 2-Sample Hypothesis Testing. 2-Sample Hypothesis Test for Means.

E N D
Hypothesis Testing 2 Samples (Chapter - 04/D) Dr. C. Ertuna
Parameters of two samples are different sample-A sample-A sample-B sample-B population-II population-II population-I Parameters of two samples are not different 2-Sample Hypothesis Testing Dr. C. Ertuna
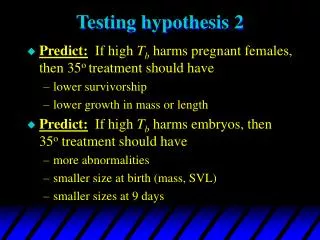
2-Sample Hypothesis Test for Means To determine whether two populations have the same or different means, one can use 2-Sample Hypothesis for means The test is based upon 3 important assumptions: • Sample selected from populations are independent, • Each population has normal distribution, • Un/Equality of population variances. Dr. C. Ertuna
2-Sample Hypothesis Test for Means • Independence within this setting (hypothesis testing) means that one observation does not affect another observation (pre and post test) • If observations are not independent than paired mean test could be used. • Independence could have a different meaning in other settings such as regression Dr. C. Ertuna
2-Sample Hypothesis Test for Means (SPSS) • Analyze / Compare Means / Independent Samples T-test / • Test Variable(s): Enter Stacked Data • Grouping Variable: Enter Grouping variable and Define it • To change Confidence Level click on Options Dr. C. Ertuna
2-Sample Hypothesis Test for Means (SPSS) The output is in the “Independent Samples Test” Dr. C. Ertuna
2-Sample Hypothesis Test for Means (SPSS) • If Levene’s test is a 2-sample variance test. If p_value of the test is less than alpha then that means variances of two groups are different. • So check the significance level of the t-test for “Equal variances not assumed” Dr. C. Ertuna
2-Sample Hypothesis Test for Means (SPSS) No distiction between upper tail or lower tail p_value p_value for 2-tailed test / 2 = p_value for 1-tailed test Dr. C. Ertuna
2-Sample Hypothesis Test for Means (SPSS) If the Hypothesis test is 1-tailed test (upper tail or lower tail; no distinction) Then If 1-tailed p_value is greater than alpha that tells us that there is NO DIFFERENCE between the means of two samples. If 1-tailed p_value is less than alpha that tells us that there is DIFFERENCE between the means of two samples. Dr. C. Ertuna
2-Sample Hypothesis Test for Means (SPSS) Decision: If there is a difference between the two samples then (obviously) the sample with higher mean value is greater than the other one. Dr. C. Ertuna
2-Sample Hypothesis Test for Means • In 2-Sample mean testSample-1 is the one that comes first in Ha:, • In 2-Sample mean test equality of variance is determined by using 2-sample 2-tailed variance test. • For 2-Sample mean testuse Excel’s Tools / Data Analysis / t-Test Two sample: Un/Equal Variance Dr. C. Ertuna
Related Samples Related (Paired) samples are samples that selected such that each data value from one sample is matched with a corresponding data value from the second sample. The paired samples are used to control for sources of variation that might otherwise distort the conclusion of a study. Example: Engine oil – mileage relation: Different cars, different drivers. Dr. C. Ertuna
Paired Samples - SPSS Assumption is that both samples are normally distributed. Enter each related sample as separate variable • Analyze / Compare Means / Paired Sample T test • Bring each variable to the right pane Dr. C. Ertuna
Paired Samples - SPSS Dr. C. Ertuna
Paired Samples - SPSS Dr. C. Ertuna
Paired Mean Test - Excel Dr. C. Ertuna
Paired Mean Test - Excel Dr. C. Ertuna
Paired Mean Test - Excel Dr. C. Ertuna
2-Sample Proportion Test Dr. C. Ertuna
2-Sample Proportion Test - Excel Dr. C. Ertuna
2-Sample Proportion Test - Excel Dr. C. Ertuna
2-Sample Proportion Test - Excel Dr. C. Ertuna
Next Lesson ANOVA Dr. C. Ertuna
2-Sample Variance Test The hypothesis testing for 2-sample variance (or Standard Deviation) could be done as follows: • Detemine Sample-1 Sample-1 is the one with largest Standard Deviation • State Ha: (and Ho:) which should start with Sample-1 • Run PhStat for 2-Sample Variance test Dr. C. Ertuna